")

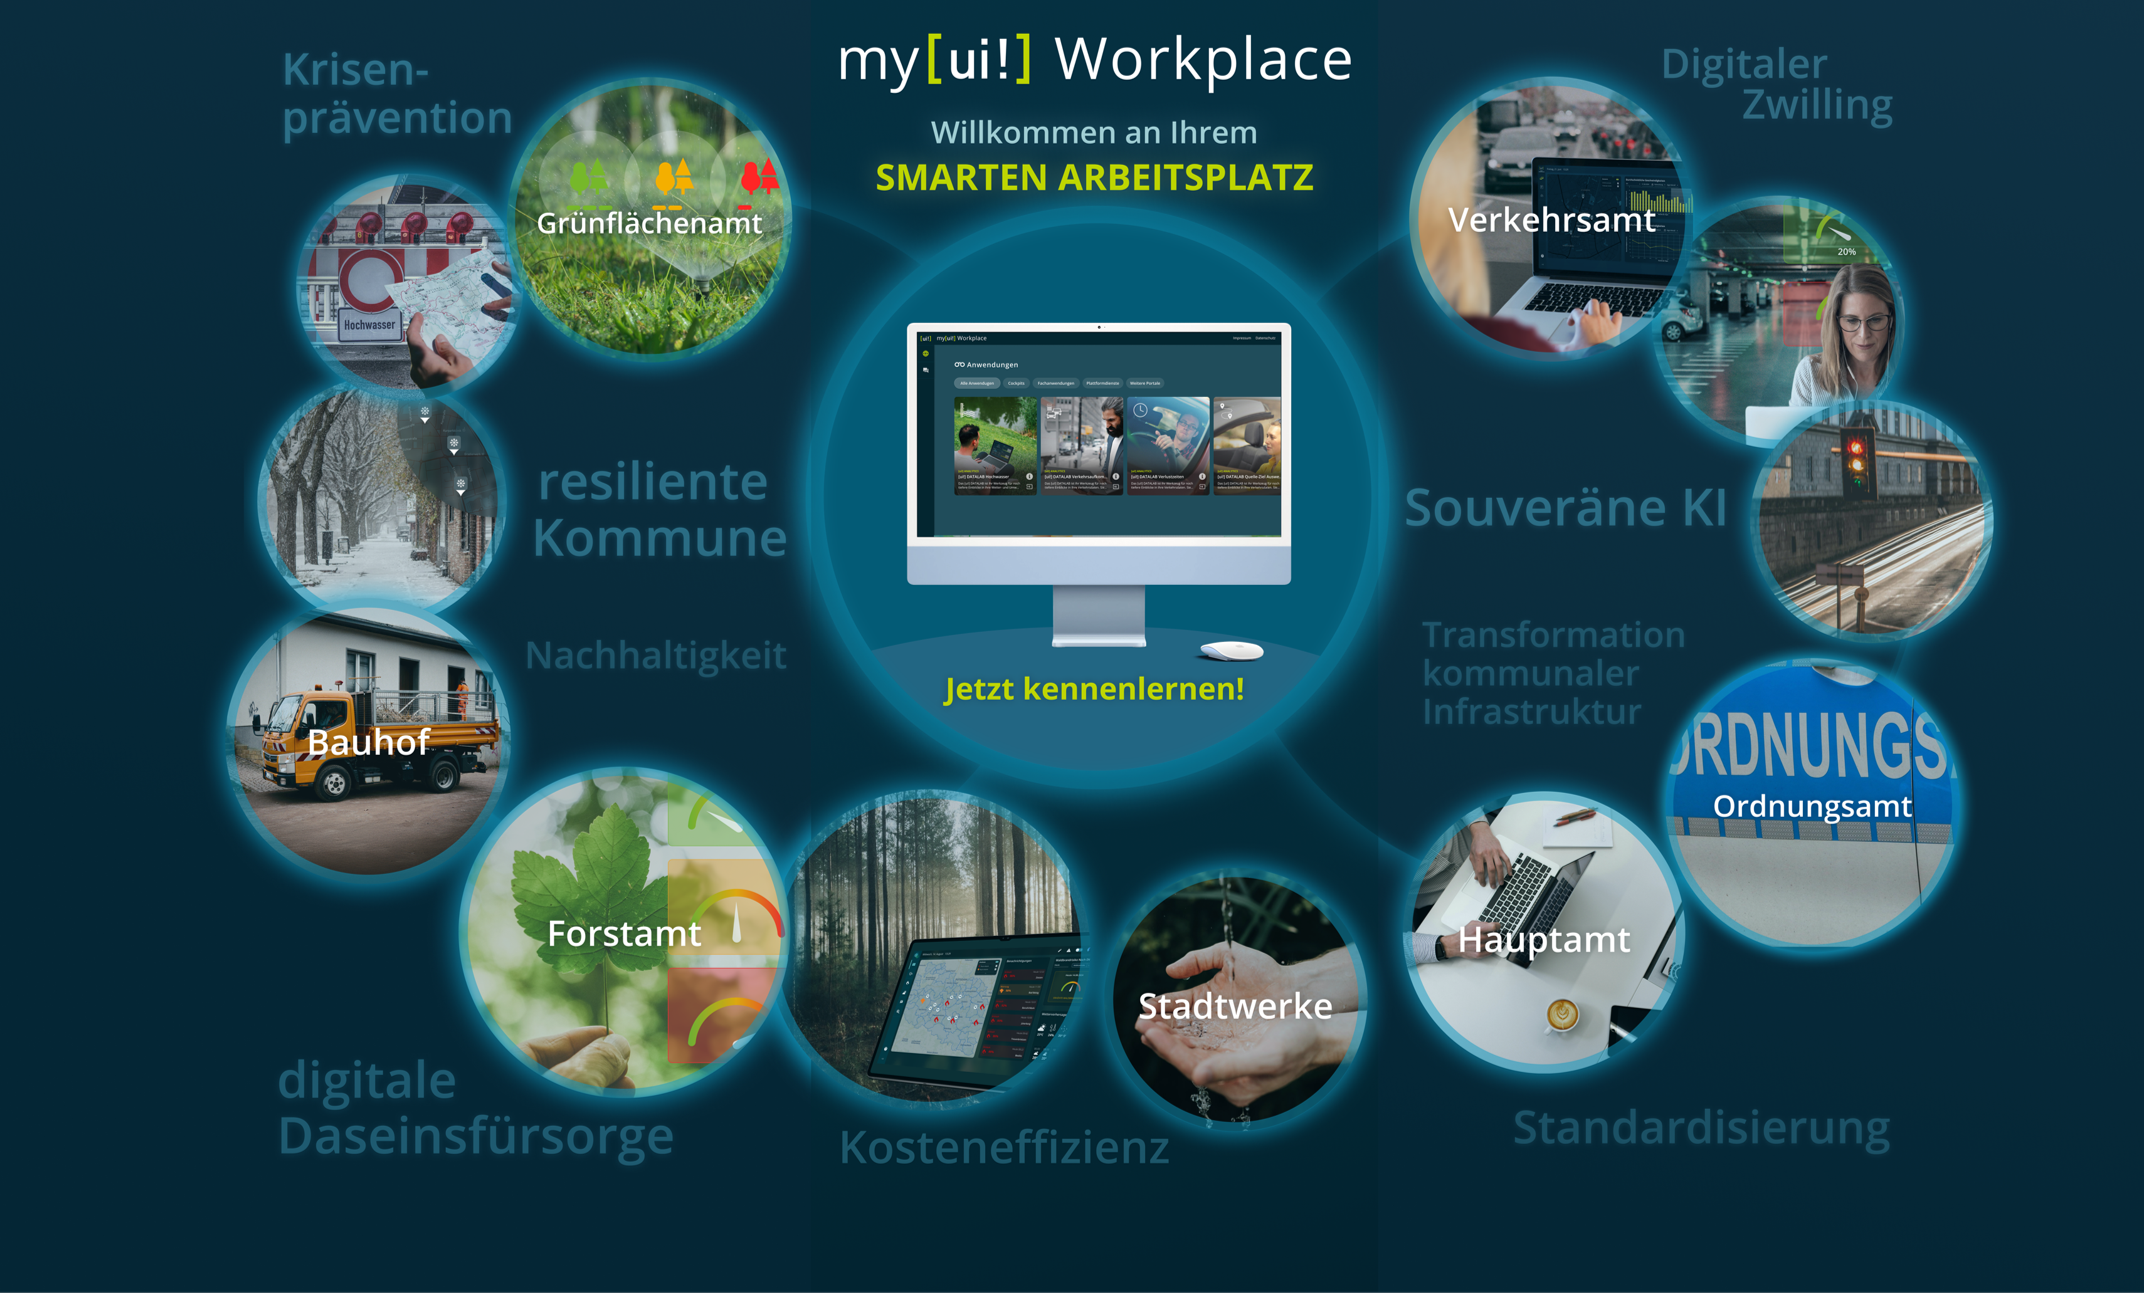
Alle Fachanwendungen und Informationen
für Ihren Arbeitsplatz auf einen Klick
Mit my[ui!] Workplace in die digitale Transformation Ihrer Kommune einsteigen!
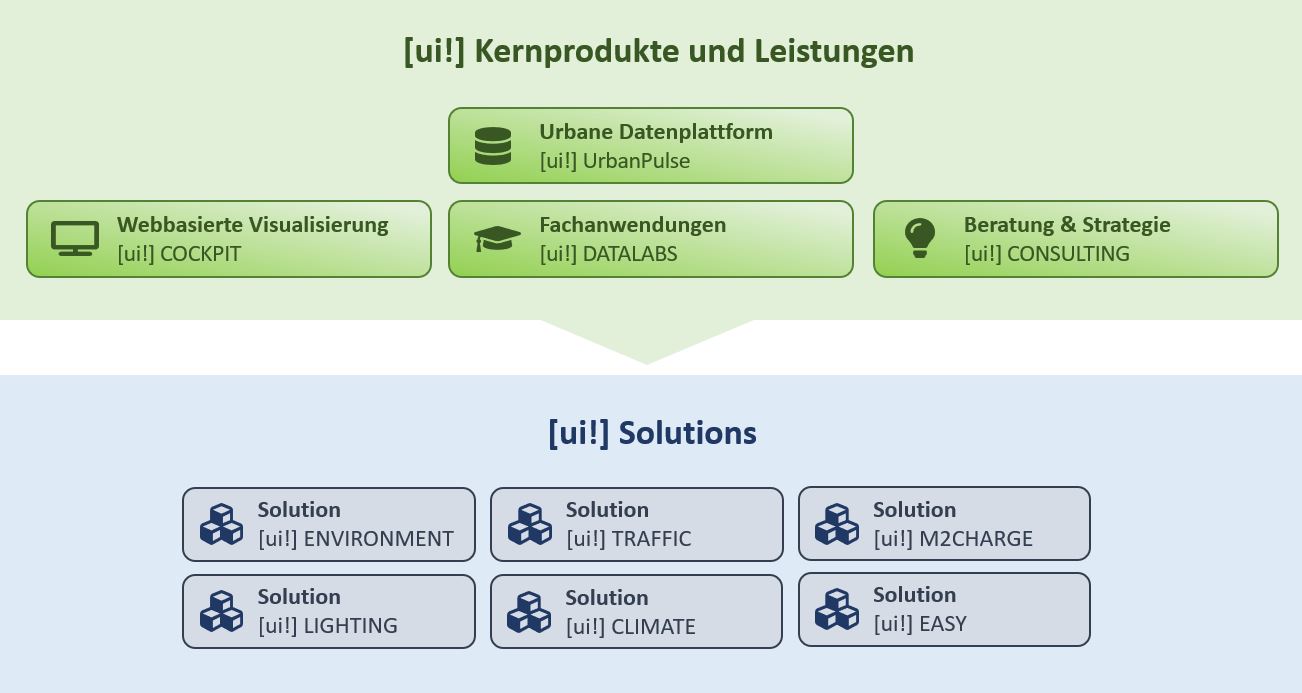
- my[ui!] Workplace
- [ui!] UrbanPulse
- [ui!] Konnektoren
- [ui!] COCKPIT
- [ui!] DATALAB
- Produkte & Lösungsansätze

Wie wird unsere Kommune smart & resilient?
-
Was muss ich beachten?
-
Was benötige ich?
-
Wie kann ich Synergien schaffen?
-
Wie kann ich vorhandene Daten nutzen?
-
Welche Möglichkeit der Darstellung unserer Daten haben wir?
-
Wie unterstütze ich Mitarbeiter in der Verwaltung bei der Entscheidungsfindung?
-
Sind die Daten in Echtzeit?
-
Welche Kosten kommen auf uns zu?
-
Gibt es Fördermöglichkeiten?
Wir geben Ihnen gerne Antworten auf Ihre Fragen und begleiten Sie auf Ihrem Weg. Unten finden Sie vier Optionen, die für die erfolgreiche Digitalisierung Ihrer Kommune notwendig oder sehr hilfreich sind:
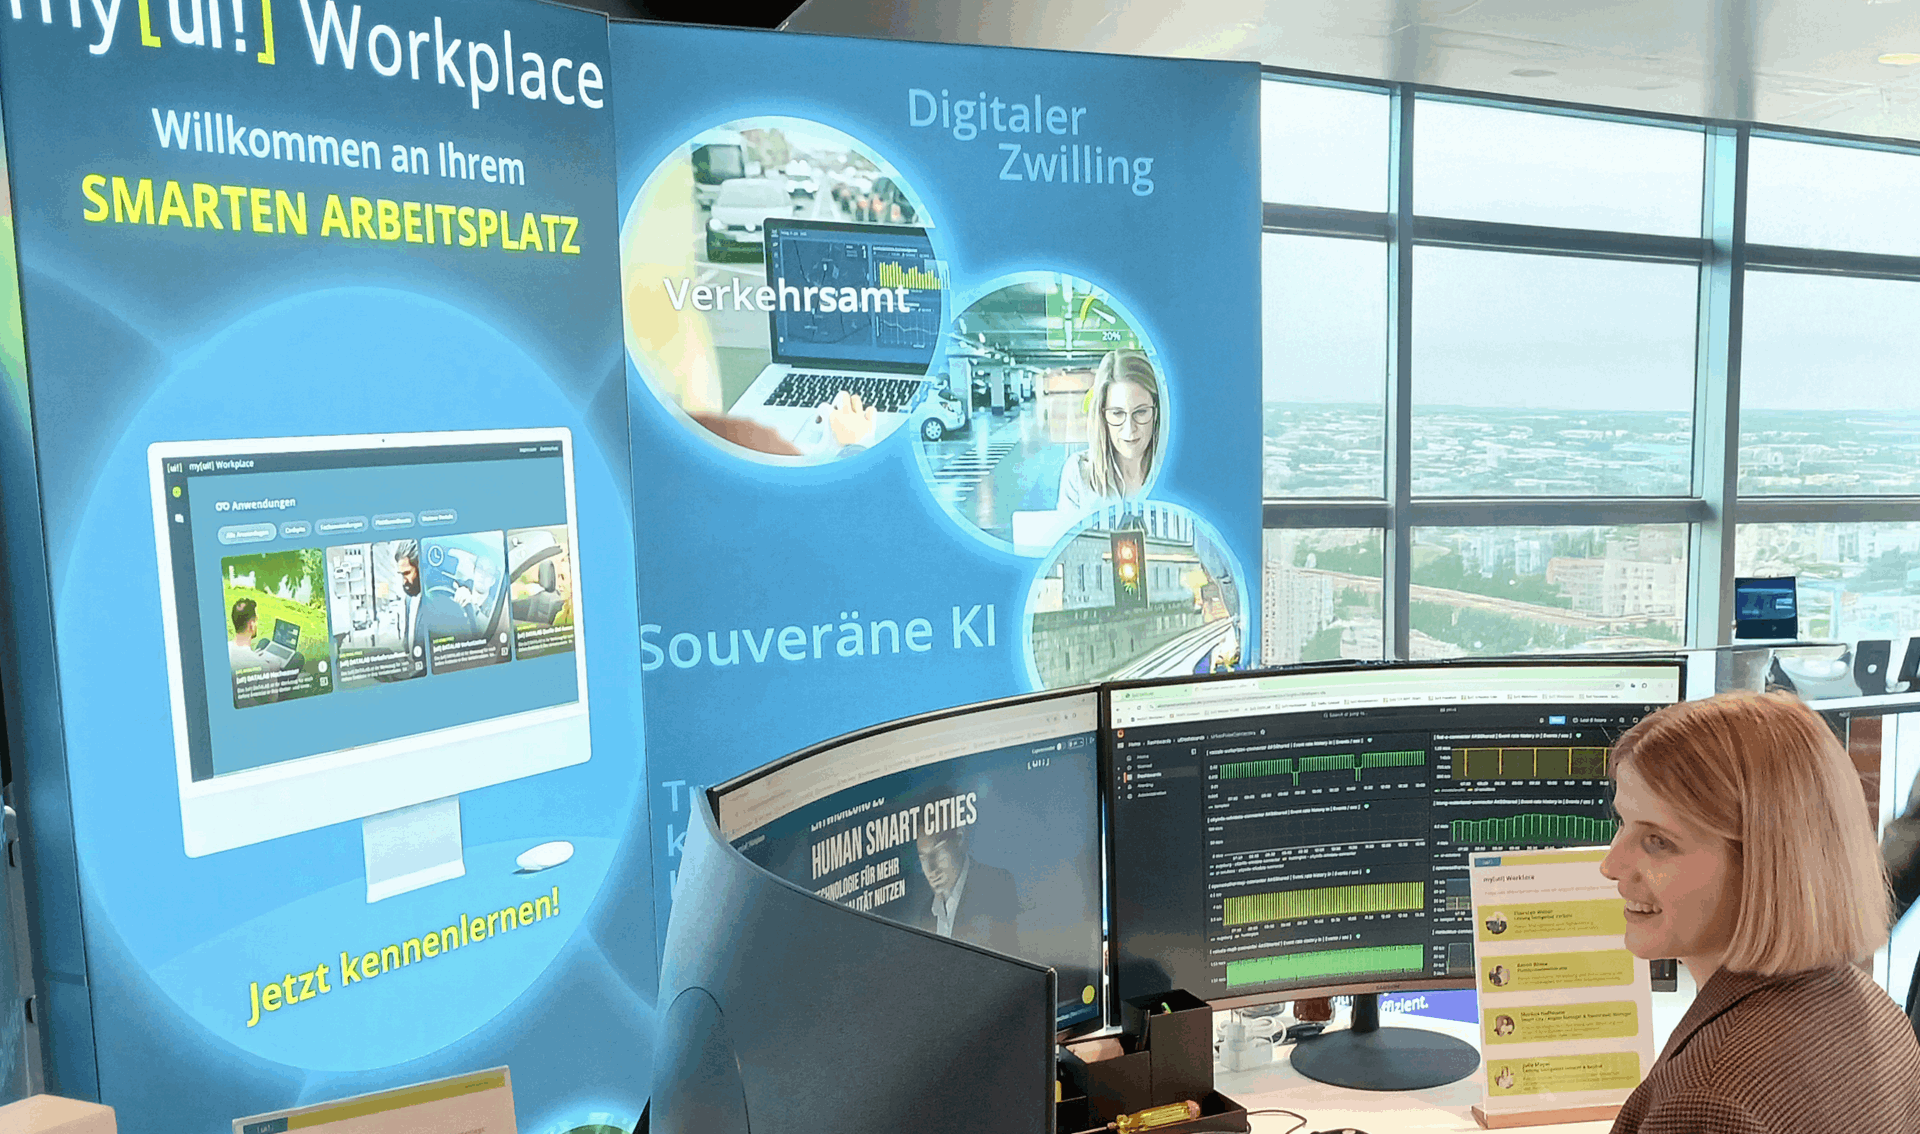
Ihr smarter Arbeitsplatz in der Verwaltung - mit einem Klick alles im Blick
Zentrale Mehrwerte für Stadtverwaltungen
My [ui!] Workpplace wird zum Rückgrat moderner Verwaltung – für digitale Bürger, befähigte Mitarbeitende und agile Services.
Wichtigste Nutzenfaktoren für Kommunen:
- Optimierte Arbeitsabläufe: Automatisierung von Freigaben, Dokumentationen und Aufgabenverfolgung
- Abteilungsübergreifende Zusammenarbeit: Echtzeitkommunikation
- Produktivitätssteigerung: Weniger Meetings, mehr asynchrone Zusammenarbeit
- Integrierte Services: Verbindung von Bürgerdiensten mit internen Prozessen
- Reduzierte digitale Reibung: Weniger Logins, weniger doppelte Dateneingaben
Fazit: Mehrwert und Arbeitserleichterung entstehen nicht nur durch den Einsatz neuer Softwarefunktionen, sondern durch innovative und smarte Arbeitsweisen.
Weitere Details zu my[ui!] Workplace
Integrierte Bestandteile von my[ui!] Workplace:
[zondicons--arrow-outline-down]
1. Digitale Basis-Infrastruktur
Offene Urbane Datenplattform
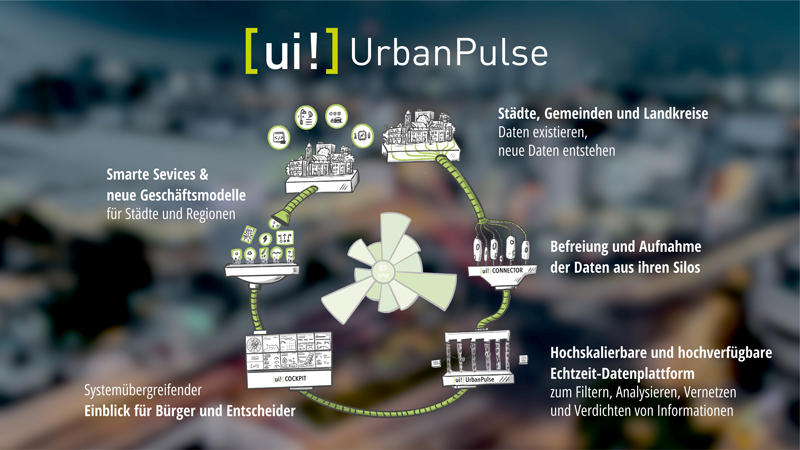
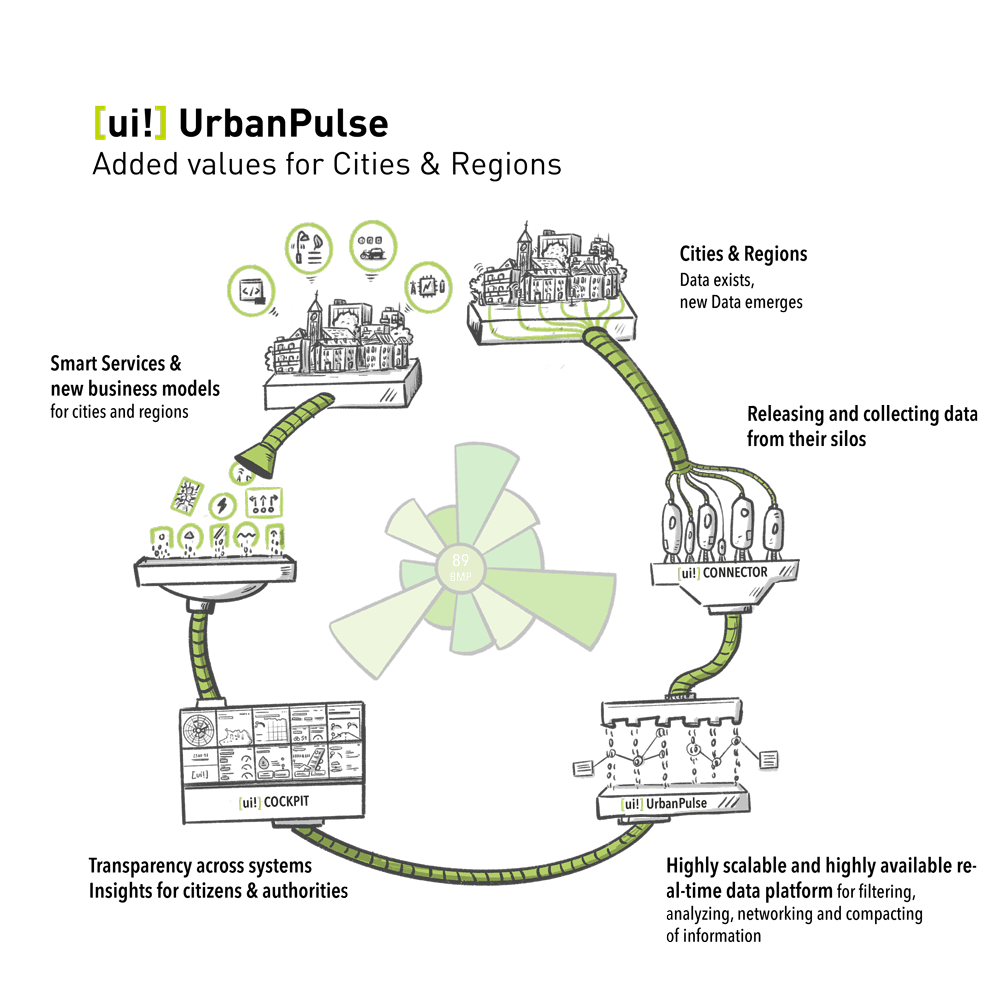
Die Offene Urbane Datenplattform [ui!] UrbanPulse bildet die Grundlage für einen Vielzahl von datengetriebenen Use Cases und zukünftigen Vorhaben zur Bewältigung anstehender Herausforderungen einer Stadt oder Region.
Sie ist eine digitale Infrastruktur zur Integration bestehender und neuartiger Infrastrukturen, Datenspeicher und Services aus dem öffentlichen und privaten Bereich dar.
- Wir unterstützen Städte, Gemeinden, Landkreise und Regionen in ihrem Bestreben, sämtliche vorhandenen und anonymisierten urbanen Daten auf einer zentralen Datenplattform zu sammeln, zu verarbeiten, zu analysieren und für neue Dienstleistungen als Mehrwerte für Städte, Kommunen und Versorgungsdienstleister zur Verfügung zu stellen.
- Diese Lösungen basieren auf einer Offenen Urbanen Datenplattform – der [ui!] UrbanPulse - wo sämtliche Daten der verschiedenen IT-Systeme einer Stadt aufgespielt werden, sodass sie für neue Smart City-Dienstleistungen in Echtzeit genutzt werden können. Sie entspricht den aktuellen Anforderungen der DIN SPEC 91357 – Referenz-architekturmodell Offene Urbane Plattform (OUP).
- Über eine Vielzahl von Konnektoren schaffen wir es, unterschiedlichste IT-Systeme so miteinander zu verknüpfen, dass alle Informationen einer Stadt nutzbar und sichtbar gemacht werden können, gleichzeitig aber die Datenhoheit bei dem jeweiligen Anbieter verbleibt. Damit gewährt die Plattform nicht nur einen integrierten Zugang zu urbanen Daten, sie beugt auch der Gefahr des Datenmissbrauchs vor.
Im Folgenden finden Sie eine Referenzliste mit einigen der bereits in [ui!] UrbanPulse verfügbaren Anschlüsse.
Acoem Duo 01db (Noise sensors)
AEC ILLUMINAZIONE (Smart Lighting)
AGT (Video analytics pedestrian recognition)
Alperia E-Mobility (Charging stations)
Alperia IoT Hub (cloud-to-cloud connector)
AQMesh (Air quality data)
Aquiba (Water Meter Systems)
Aruba (Smart WiFi Systems)
ATB Park & Display (Parking Ticketing Systems)
Australian Bureau of Meteorology (climate data)
Bayern Cloud (tourism data)
BaumHoch4 (ground moisture)
Berliner Luftgütemessnetz (Environm. sensors)
Bernard Brenner (Parking sensors)
Bernard Brenner Data center (Parkingsites management system)
BigBelly (Smart Trash bins)
Birtinya Parking (Smart Parking)
Breeze (Environmental sensors)
Brisbane Parking (Parking occupancy sensors)
Brisbane Traffic (Traffic detector data)
Brunata (Heating meter)
Cairns (Smart Parking System)
Cambio (Car sharing platform)
Casambi (Smart Lighting)
Chargecloud (Charging stations)
ChargeIt (Charging data)
ChargePointOperator (OCPI Charging data)
Cisco Meraki (Smart WiFi Systems)
Civento (Construction Sites)
Clean City Networks (Waste bin data)
Cleverciti OffStreet (Parking Management)
Cleverciti OnStreet (Parking Management)
Cleverciti Ticks (Parking Management)
Cologne Parking (Parking garages data)
Cologne Traffic (Traffic flow data, Traffic Obstructions)
Comark Laser Scanner (Bike detection sensors)
Connctd IoT (Smart Home System)
Continental Carsharing (Car sharing platform)
Corona Incidence Report (COVID-19 Situation)
Count and Care (MQTT connector)
Crossfleet (Car sharing platform)
CSV Data (generic data import)
Datex II (traffic data)
DB ParkSpace (Parking Data)
DB Flinkster (Car Sharing)
DB Call a Bike (Bike Sharing
DEFAS (Public Transport data)
DFKI onboard Unit (Car Telemetry Interface)
Discovergy (Smart Meter data)
Duo Smart Noise (Noise sensors)
Eco-counter (Traffic count data)
e-sensio urban SmartBox (Environmental Sensors)
EarthSense (Air Quality)
EDIFACT MSCONS (Energy Data)
Eluminocity (Charging data)
Emio (Environmental sensors)
EnBW Sm!ght (Smart lamp post, Environmental Sensing & EV Charger)
Enevo (Waste bin data)
e-netz InfoMap (Construction Sites)
Entega (Energy Distribution Grid)
Feratel (Event Calendar)
FHEM (Smart Home System)
FlareSense (Environmental data)
FlexDB (Energy data management system)
Fleximodo (parking sensors)
Fleximoto (Water level sensors)
FLIR Flux (Traffic Camera Server System)
FLIR ITS (Traffic Cameras)
Floodmon (Flood Monitoring System)
GfS (Noise & weather station)
GoodMoovs Tomp (Car sharing platform)
Go Space Parking (Parking data)
Graphmasters Nunav (Traffic forecasts)
GreenWay (Digital Signs)
Group Alarm (Alarm notification system for mission critical operations)
GTFS (Public transport data)
H2MParking (Temporary parking data collection)
HAMIS (Harbor information system)
Hawadawa (Environmental sensors)
Hessenalarm (Alarm notification system for mission critical operations)
HLNUG Messdatenportal (Environmental data)
HLNUG WISKI (water level data)
Homee (Smart Home data)
Hubeleon (Chargepoint Management System)
Hystreet (Passenger Frequency)
ICE Gateway (Environmental sensors)
INCOTEC (Passenger Frequency)
INRIX (Parking data)
Intelliport IPS-403 NB-IoT (Traffic Sensor)
JSON Schema (generic data import)
KairosDB (Timeseries Database Connector)
Kerlink LoRa IoT Station (LoRaWAN Gateway)
Kimley Horn KITS (Traffic data)
Klimaherzen (CO2-Savings Incentive system)
KNX (Building Management System)
KVB (Public transport station data)
LanUV (NRW environment data)
Las Vegas Traffic (Traffic detector & signal state data)
Libelium Plug&Sense Smart City (Sensor devices)
Libelium Plug&Sense Smart Environment (Sensor devices)
Libelium Plug&Sense Smart Environment Pro (Sensor devices)
LuenNi (Niedersachsen environment data)
manageE (per second energy meter)
Marine traffic (Ship monitoring system)
MDM (moblity data marketplace)
Mobileeee (e-Carsharing data)
Modality (Container management system)
Modbus (Building Management System)
MOL BuBi (Hungarian bike sharing platform)
MQTT (generic MQTT Receiver)
Mr. Fill (Smart Trash bins)
Munisense (Noise sensors)
Netatmo (Environmental Sensors)
nextbike (Bike sharing platform)
Node Red (Data flow system)
NXP (RFID tag data)
NYC Traffic (Traffic detector & signal state data)
OCIT-C (Standard for Traffic Management Systems)
OCPI Last Mile Solutions (EV charging)
Olbring (water level sensors)
One M2M (cloud-to-cloud connector)
OpenWeatherMap (Weather data)
OWLET Nightshift (Luminaire status and energy consumption data)
OWLET IOT (Luminaire status and energy consumption data)
Philips City Touch (Smart Lighting)
Pimcore Plattform (Asset Management)
Public Wifi (generic Wifi Locations)
Purple Air (Environmental Sensors)
Purple Wifi (Smart WiFi System)
RhineCloud (Parking data)
Reekoh (cloud-to-cloud connector)
RMV (Public Transport in Hessian, Germany)
RTB Verkehrstechnik (Traffic counting systems)
Ruckus (Smart WiFi System)
RUDIS (cloud-to-cloud connector)
SAP Open e-Mobility (Charging Stations)
Scheer (Energy management)
Schréder EXEDRA (Smart Lighting)
Screen scraper (Data extraction from websites)
SCC geoserver (spatial data)
SCC Solarfarm (PV and weather data)
Scheidt & Bachmann (parking data)
Scoot (Adaptive Traffic Control Systems)
Seeketing Observer (Pedestrians frequency)
Sensoterra (ground moisture)
SensorThings (Open Geospatial Consortium-Standard)
Sentry (MQTT broker)
SIEMENS SENTRON (Energy Monitoring & Power Distribution)
SIEMENS (Traffic Management Systems)
Smart City Systems (Parking Data)
Smart Link (Irrigation data)
Spot (Environmental Sensors)
SPP Analytics (Signal Phase Timings)
Stadtwerke Aalen (Parking management)
Sustainder Brokerage (Smart Lighting)
SWARCO KR (Traffic Management System)
SWARCO TMS (Traffic Management System)
Swisstraffic (Traffic detector data)
Tier Mobility (Scooter Sharing)
Tom Tom (Traffic data)
Translink (Public transport data)
Tüga Plusportal (Smart Wifi System)
TVILIGHT (Smart Lighting)
[ui!] TRAFFIC (inner City traffic density)
Vaisala (Environment – receives pushed data)
Vaisala beacon cloud (Environment sensors)
Vaisala Mobile Detector (road conditions)
Vaisala WX Horizon (road conditions)
Vaisala Xweather (Environment sensors)
VDH (Traffic counting & video)
Vivacity Labs Tracks (Traffic management)
Vivacity Labs V2 (Traffic management)
Vivarium (Smart Zoo)
Viom Floating Car Data (FCD)
WaveScape (Crowd based sound measurement platform)
Wikidata (City Info)
Wordpress (Newsfeed)
YellowMap (Charging stations in Germany)
Ymatron (Waste bin data)
Zenner ElementIoT (LoRaWAN network server)
Zendesk (Ticketing system)
Zeta (Charging controller)
ZTIX (Event Calendar)
Weitere Konnektoren sind aktuell in der Entwicklung…
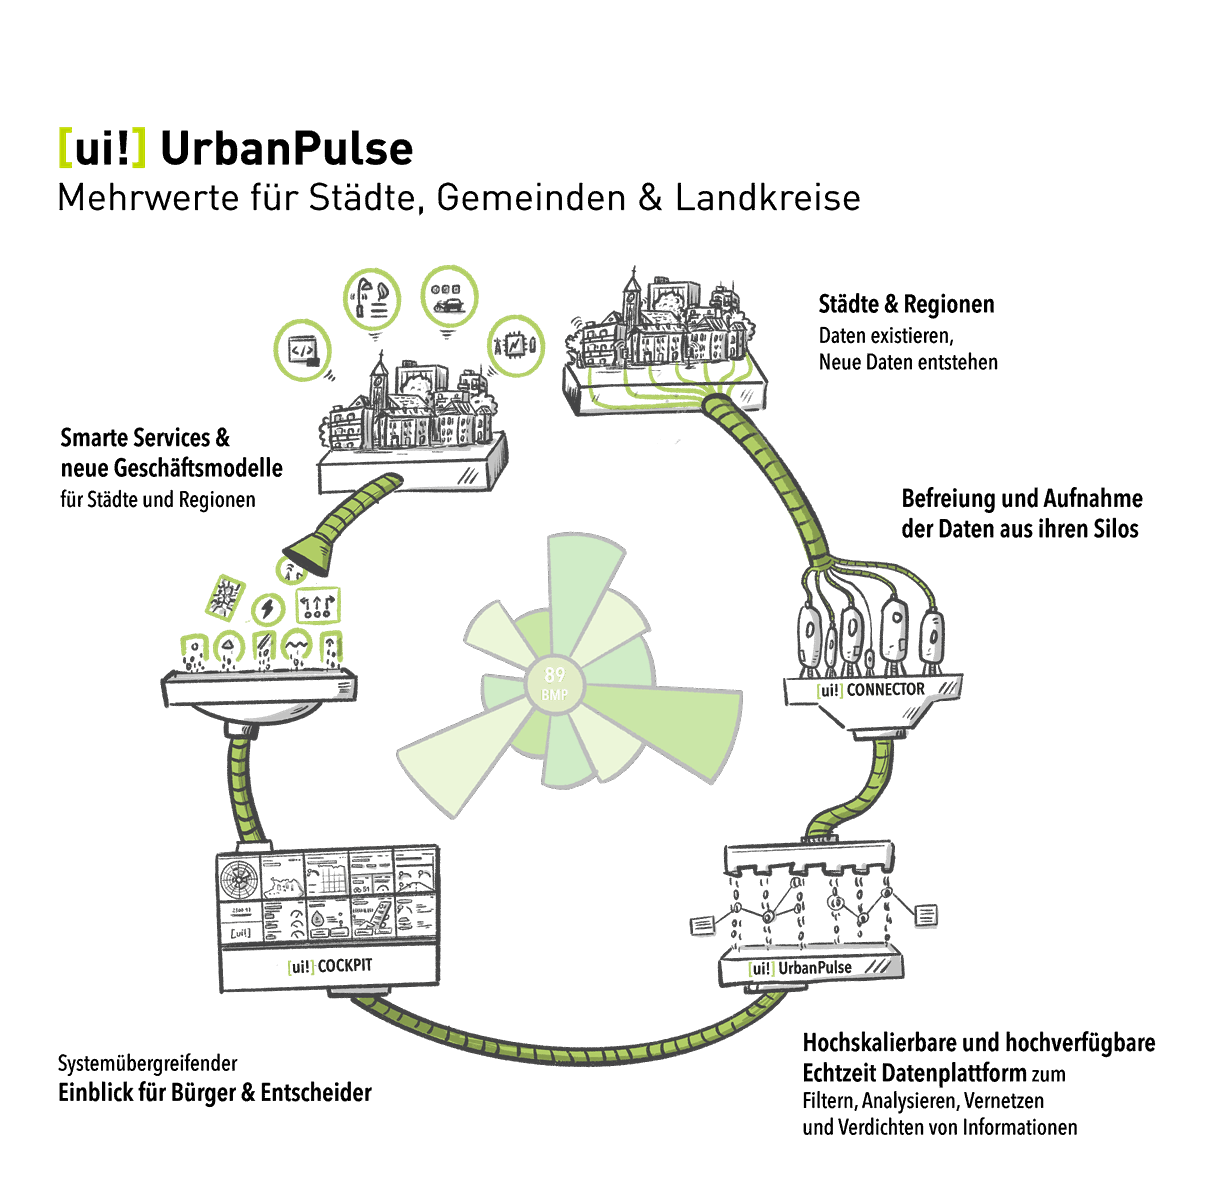
Durch die Digitalisierung der öffentlichen Hand entstehen im Rahmen digitaler Anwendungen und kommunaler Infrastrukturen mittels digitaler Mess- und Steuerungsgeräte kommunale Daten. Diese liegen oftmals in Silos kommunaler Infrastrukturen und werden fachspezifisch und isoliert genutzt. Durch den Einsatz einer kommunalen Datenplattform nach DIN SPEC 91357 können diese sicher an einem zentralen Ort zusammengeführt werden.
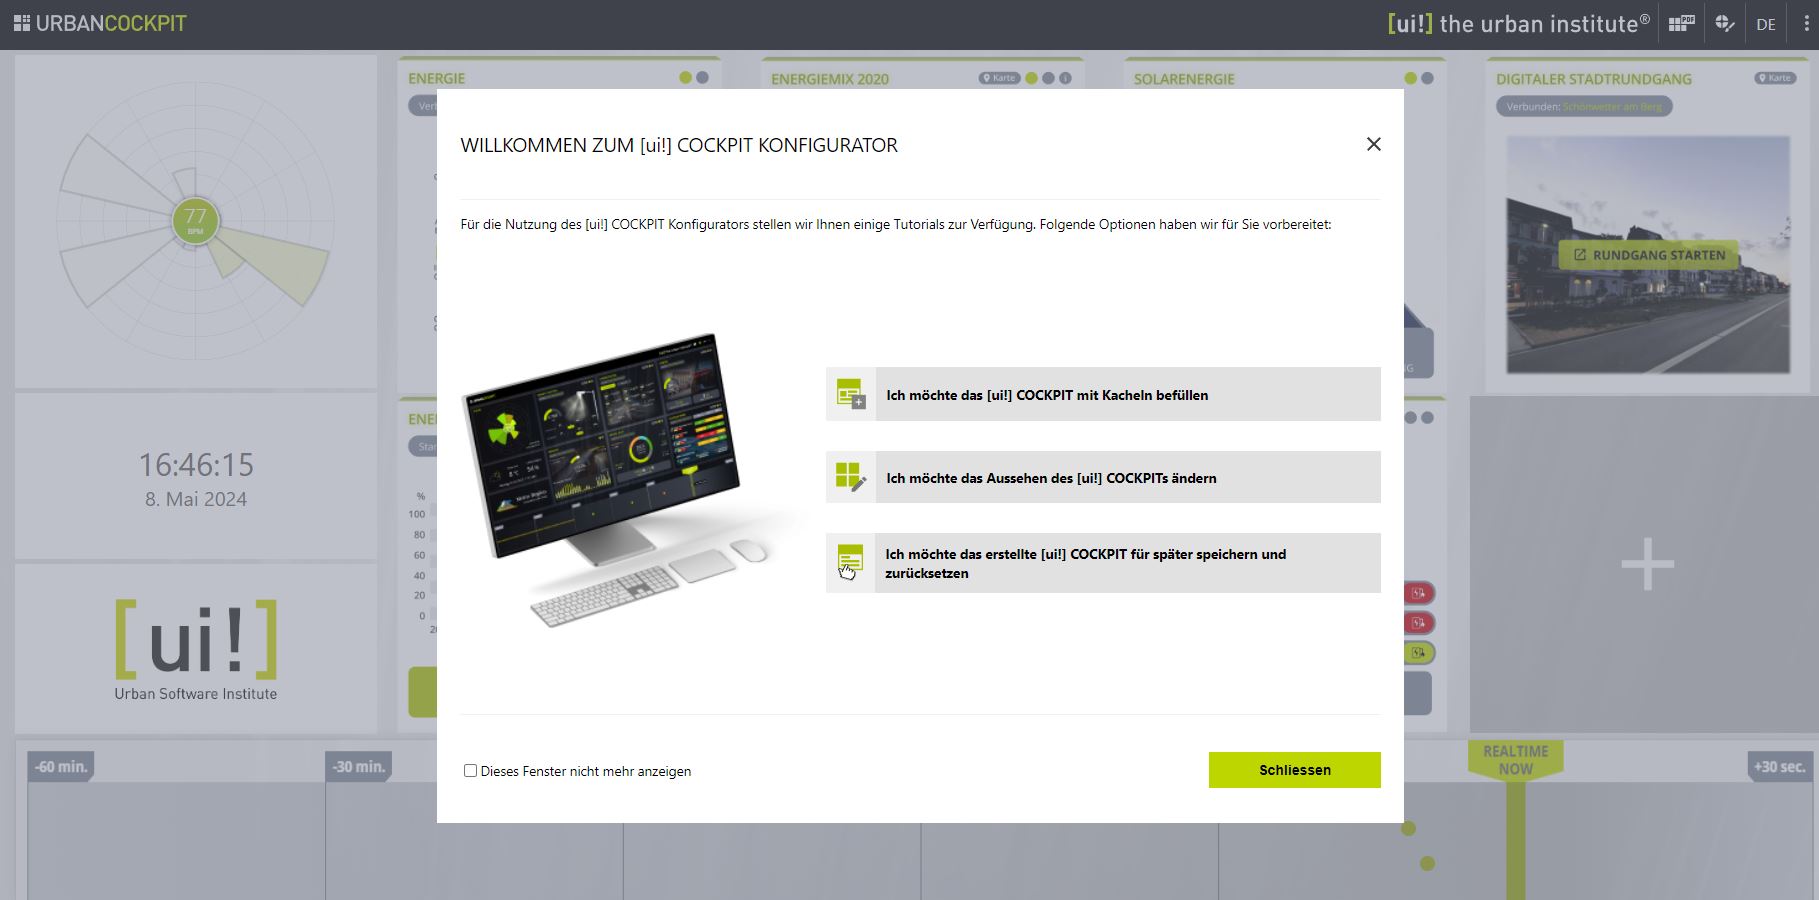
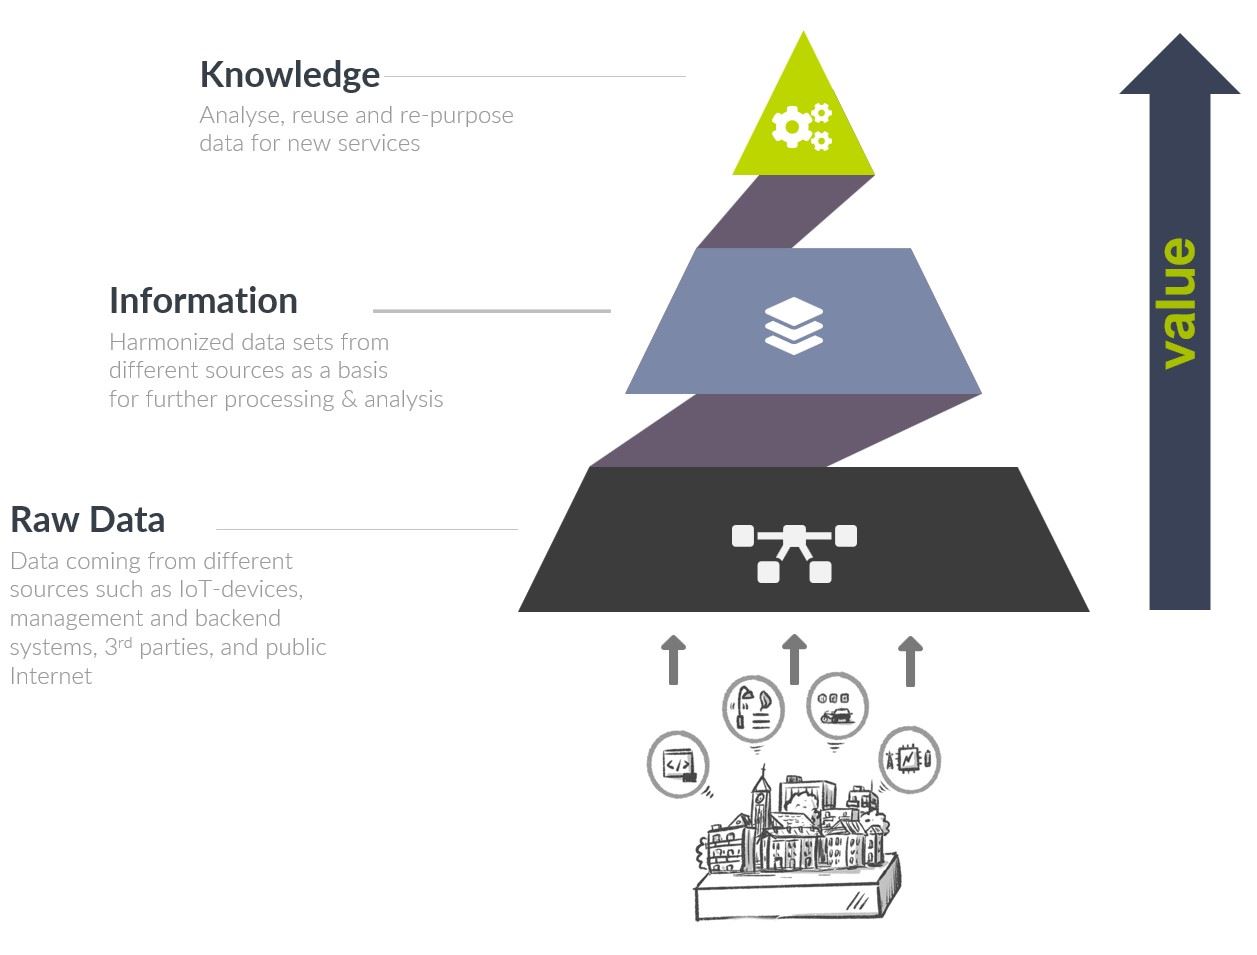
2. Visual processing of the data
Generate and visualise knowledge from data
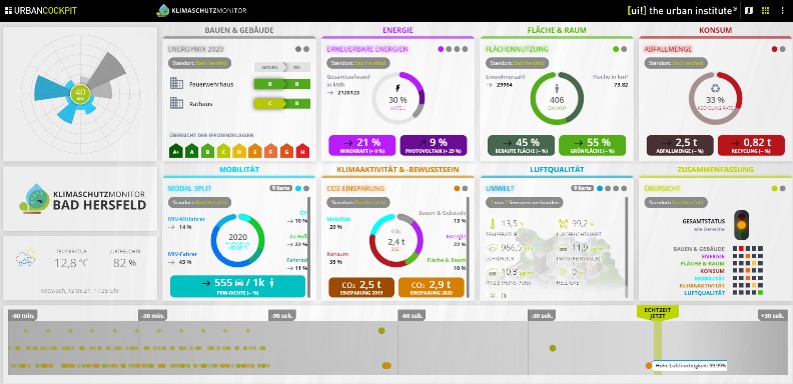
The data collected, analysed and processed on the [ui!] UrbanPulse open data platform is presented to interested citizens in a user-friendly way via the web-based application [ui!] COCKPIT visual. Various municipal topics are presented in different "tiles", such as
- The data for the land utilisation (available green space in comparison to the built-up area) are shown.
- Information on waste management (amount of waste compared to the proportion of recycled waste) can be visualised.
- CO2 savings: This tile offers the possibility to display the CO2 emissions saved in the various areas. aufzulisten und tagesaktuell zu vergleichen.
- Energy mix: The energy efficiencies of the various municipal properties can be presented and compared here in a very comprehensible manner, similar to the energy performance certificate. At the same time, a target value can be defined.
- Energy history: Here you can see how much energy has been generated from various sources over the last 7 days, including renewable energy sources compared to fossil fuels.
- Renewable energies: In line with the "Energy history" tile, you can view the generation and share of renewable energies in a pie chart.
Environmental protection
- Environmental measurement data: We offer you several available tiles for this use case.
- Smart Waste: Intelligent waste bins of the "Big Belly" or "Mr Fill" type can be connected.
- Noise pollution: Sensors that continuously record noise pollution can be integrated for this use case. These are clearly displayed on a tile.
- Flood protection: A tile is available for the flood protection use case, which both citizens and decision-makers can use to constantly view the current water level.
Energy efficiency
- Charging infrastructure: The charging stations of a provider can be integrated. A suitable connector must already be available for the provider.
- Street lighting: Municipal street lights can be integrated and displayed. The luminaires must come from the same system - this currently includes Schréder Exedra, Philips CityTouch and Schréder Owlet IoT.
- Astro clock: The planned individual switching times of the street lighting depending on the times of the sun are graphically processed and clearly displayed here. This enables the local authority to estimate how much electricity will be consumed by the sun-controlled switching times today.
- Presence-dependent lighting control: If you have installed a lighting control system that regulates the brightness depending on presence, you can connect this to [ui!] EASY and display both the current brightness and the course of the day in the [ui!] COCKPIT.
- Energy savings: In addition to the "Energy history" tile, you can view the total annual energy saved here. This is compared with the previous year and displayed as CO2 equivalents saved.
- Solar energy: The output of a PV system varies and naturally depends on the available solar radiation. With this tile, you can see directly how much the municipal PV systems connected to the data platform are currently generating, as well as the accumulated energy over the day.
- City information: This tile displays information on the area of the city, the current number of inhabitants, the number of data sources and other important key figures. This tile is always automatically included in the [ui!] EASY solution.
Mobility, traffic & parking space management
- Smart Parking: The percentage occupancy of parking spaces can be displayed in a tile. This includes both on-street parking sensors and camera-based systems that record the occupancy of a parking space.
- Parking: In addition to the "Smart Parking" tile, various parking spaces and their current utilisation can be integrated here. These are displayed in rotation so that the user has an overview of all the car parks in the municipality that are recorded and connected.
- Modal split: The "Modal split" tile can be used to visualise how modalities are used in the municipality. It can be used to answer citizens' questions, e.g. how many people use public transport, the bicycle or their own car.
- Charging stations: The occupancy of several charging points at one location is shown in a list. At the same time, it is also recorded whether the associated car park is also available. In this way, users can see in advance whether it is worth travelling to the charging point.
- Digital city tour: You can use this tile to invite your citizens to take a digital city tour. Of course, you can also link another application here that invites citizens to interact more.
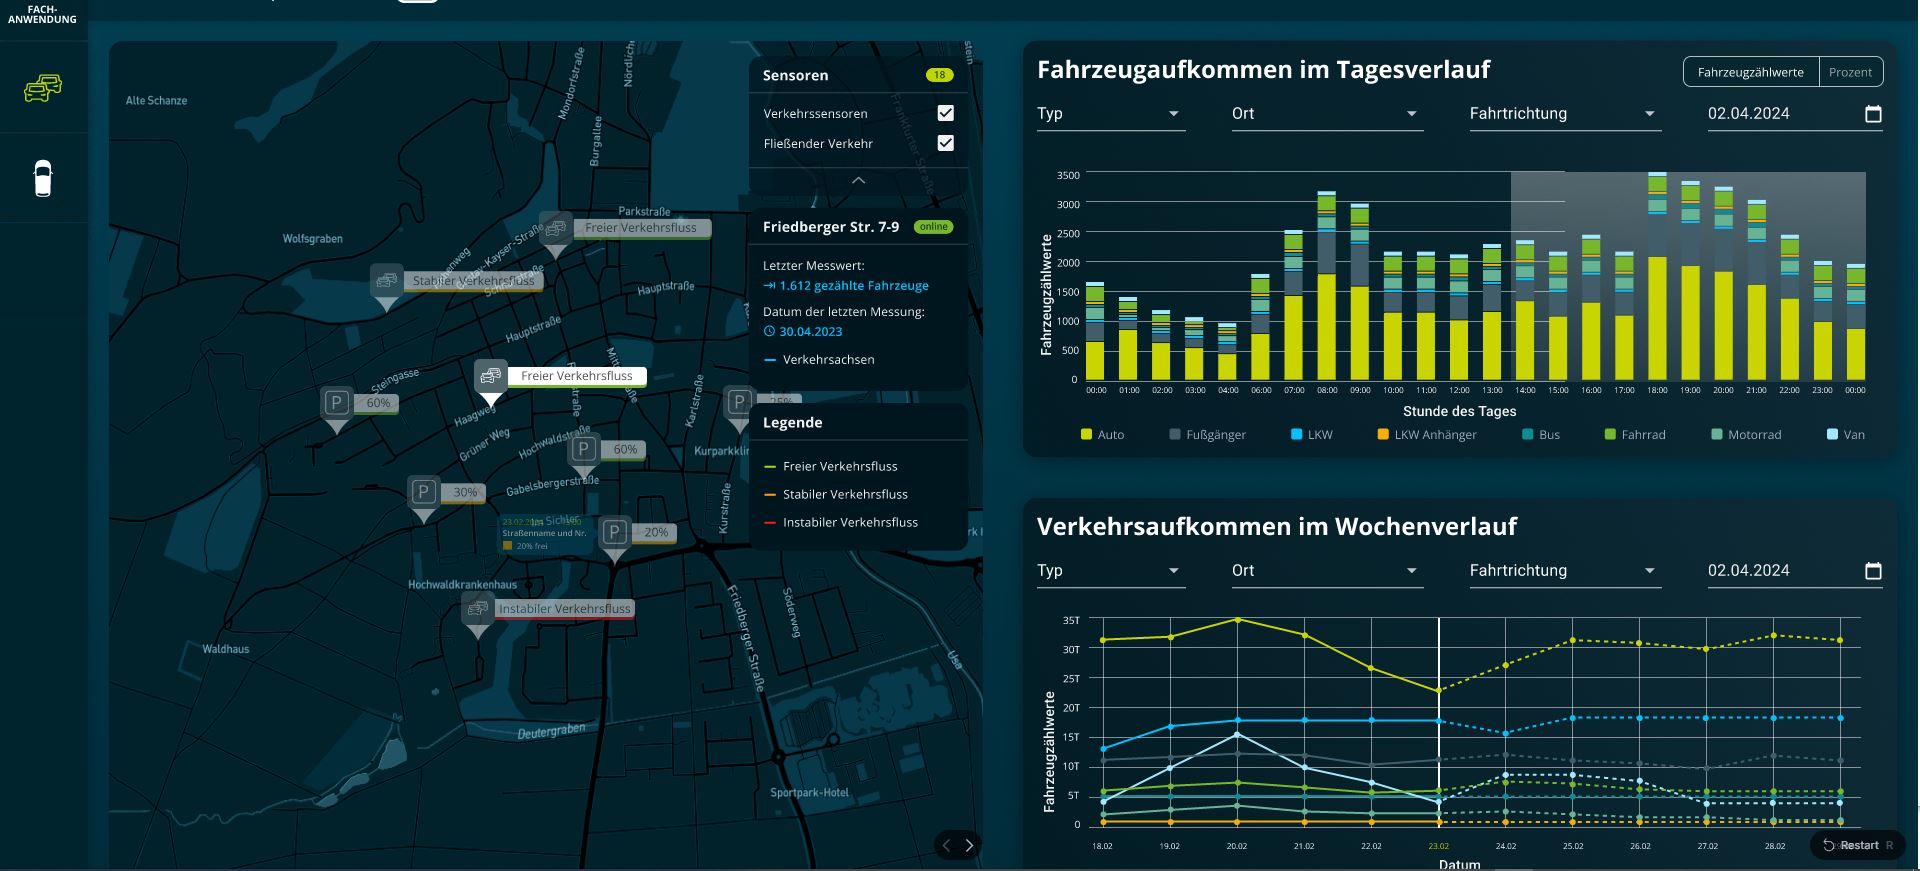
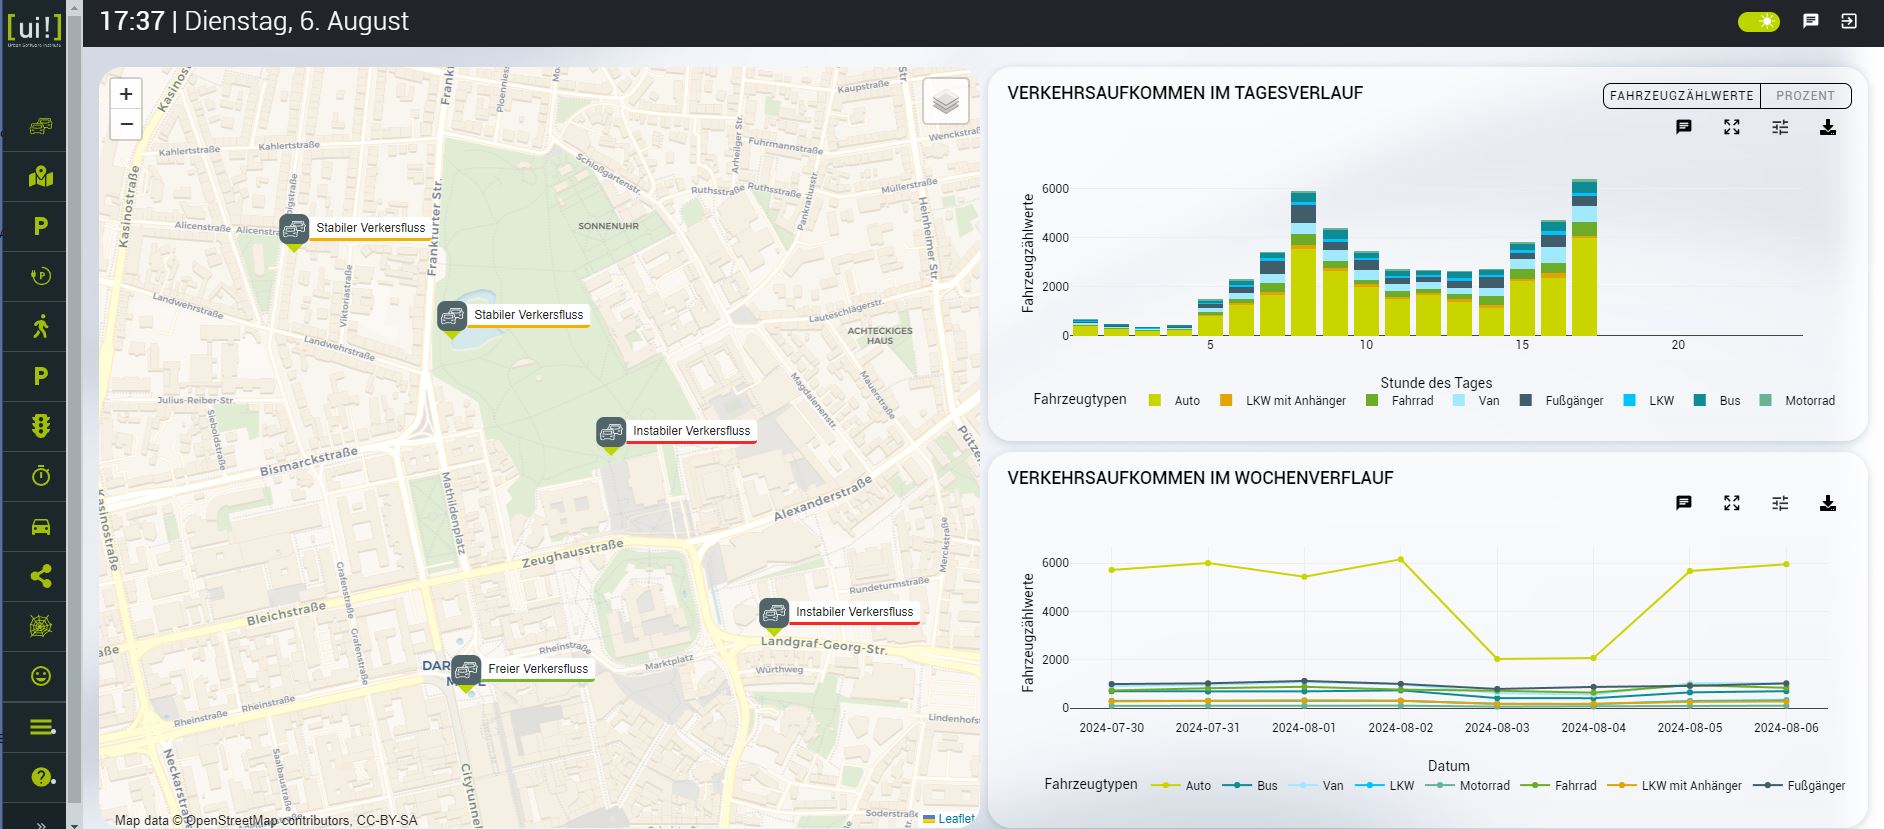
- Traffic monitoring: This tile shows you the current traffic volume and the vehicles counted over the last 24 hours at a glance. You can immediately see anomalies and recognise recurring patterns and take specific and targeted measures to counteract any increased traffic volume.
- Traffic-dependent light control: As with presence-dependent light control, which is primarily aimed at pedestrians, it is of course also worth adapting the light control of the street lighting to the traffic. With this tile, you can view both the counted vehicles and thus the current traffic, as well as the progression over time.
- Traffic information: This tile displays the current roadworks in the area of the municipality in a user-friendly way. The map view complements this tile perfectly, as users can view the current and even planned roadworks directly on the map.
[ui!] FESTIVAL-COCKPIT
Using the [ui!] Festival COCKPIT, which was specially developed for large events, important data such as traffic volume and traffic speeds, weather data, car park occupancy, visitor numbers, temperature and environmental data, towing procedures and much more can be displayed on a control station in real time. This means that those responsible have an up-to-date overview at all times and can intervene if necessary.
-
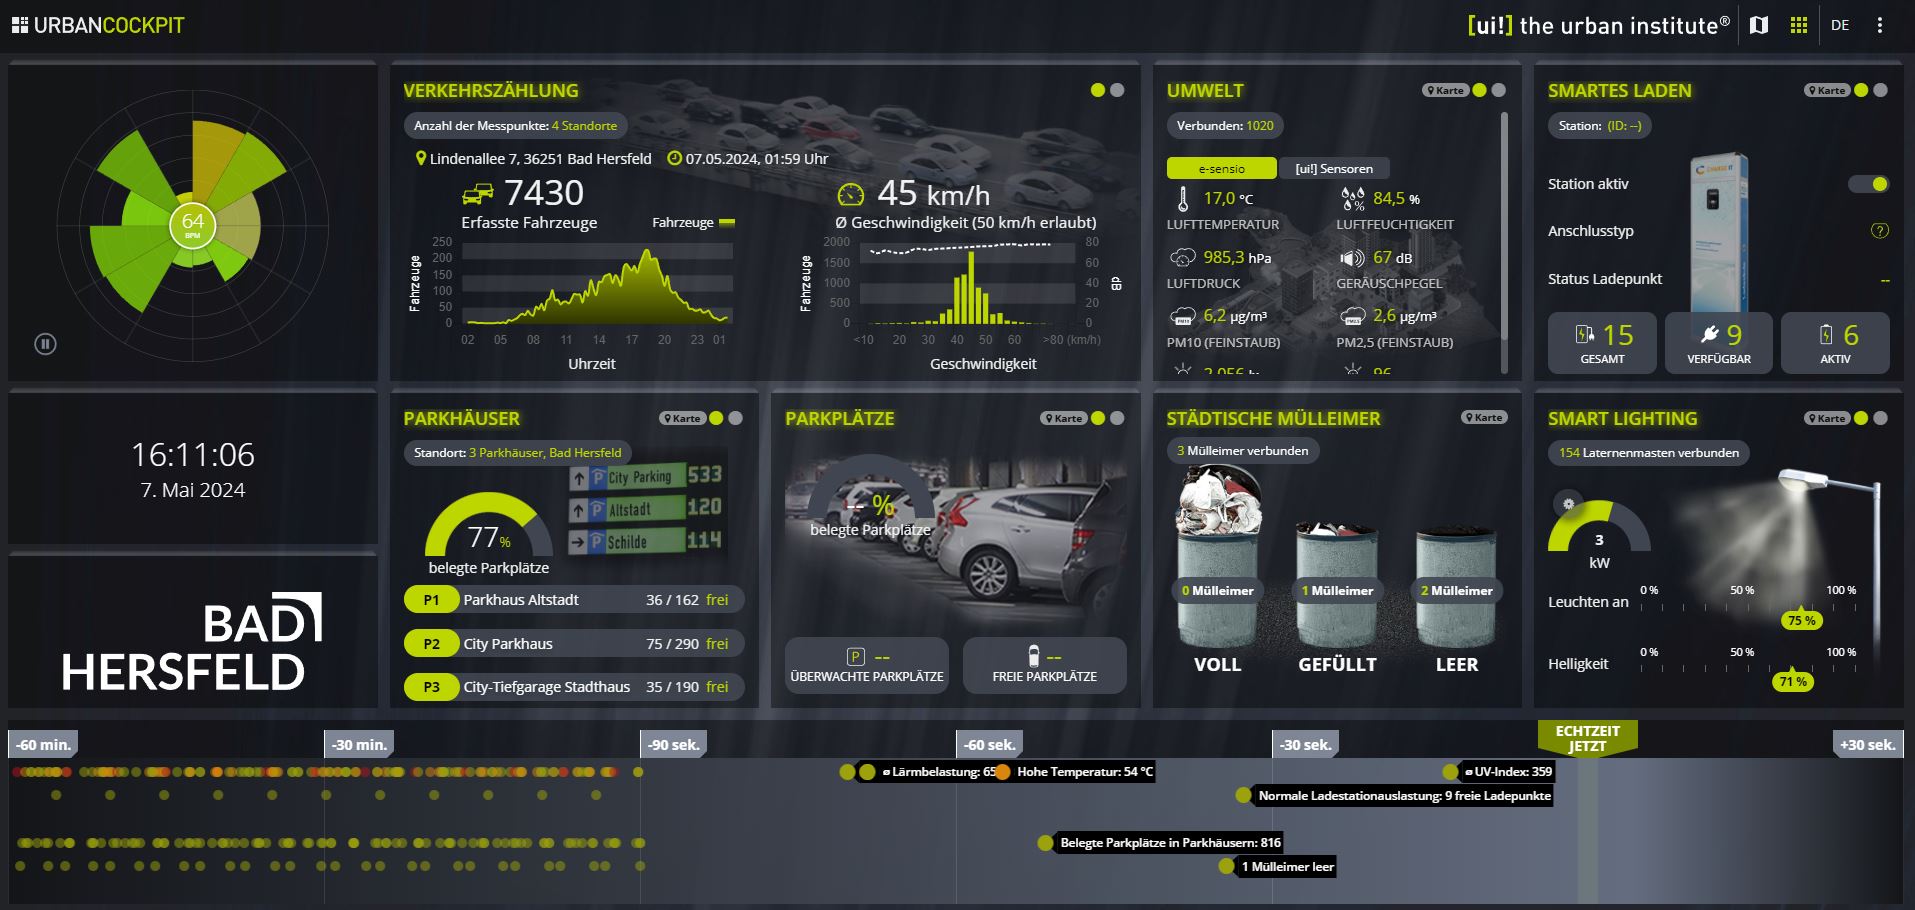
COCKPIT Bad Hersfeld
-
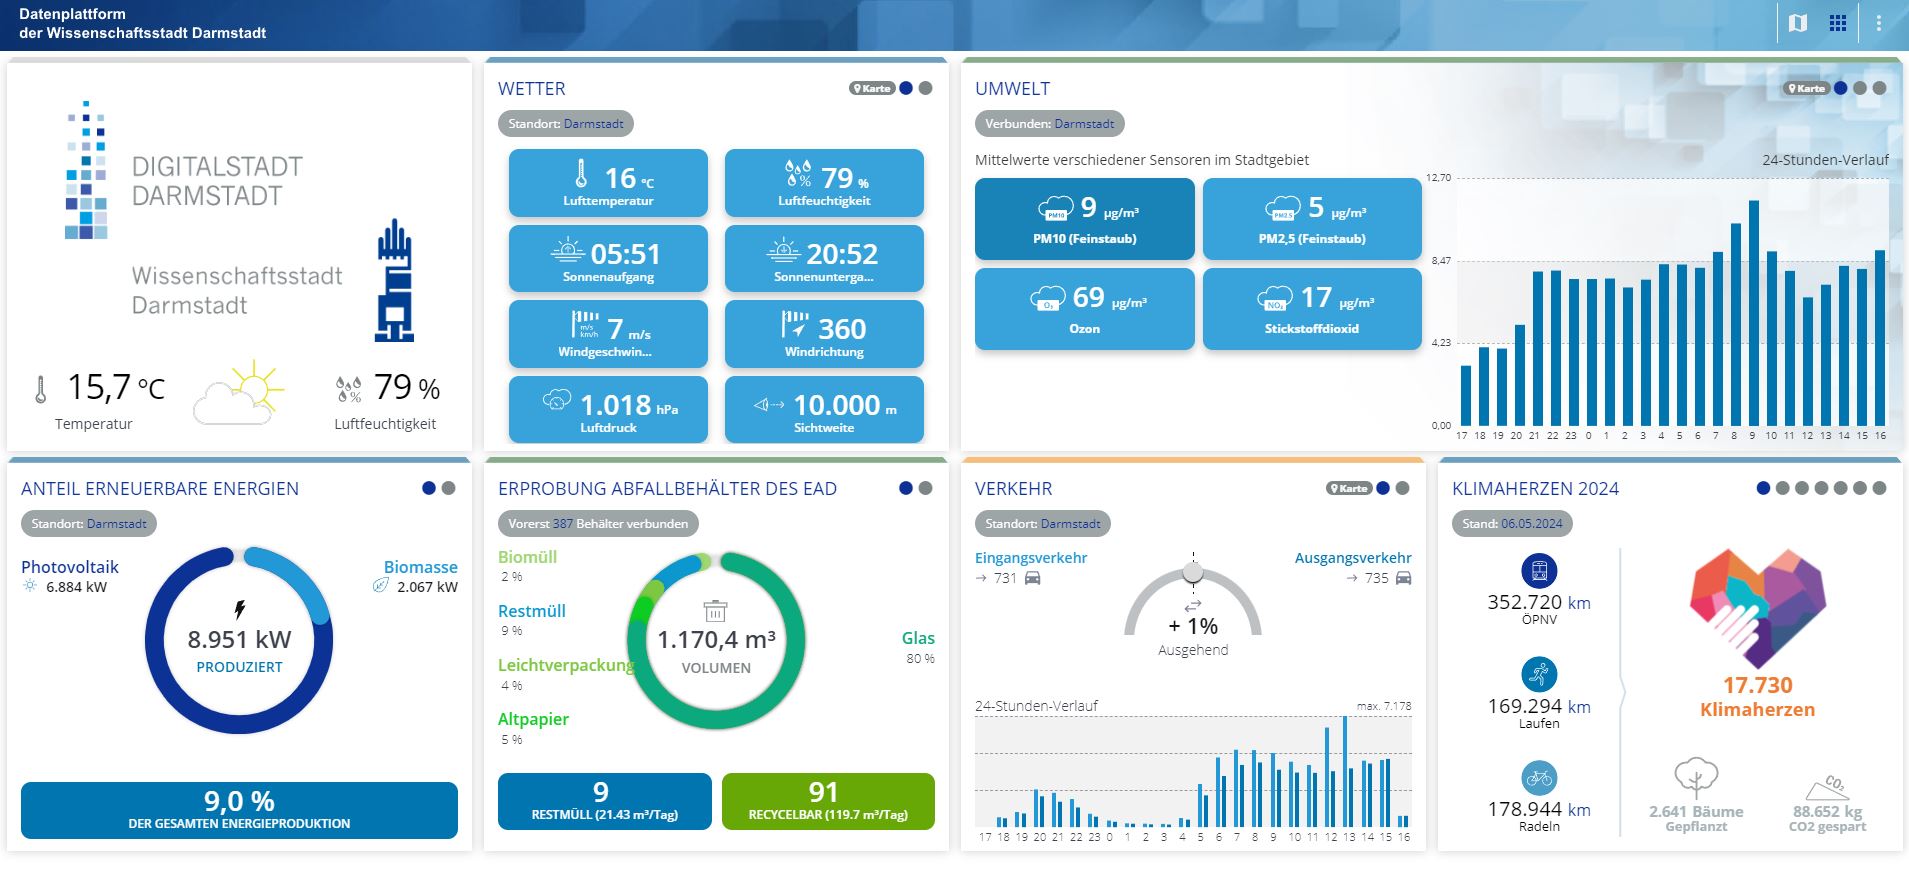
COCKPIT Darmstadt
-
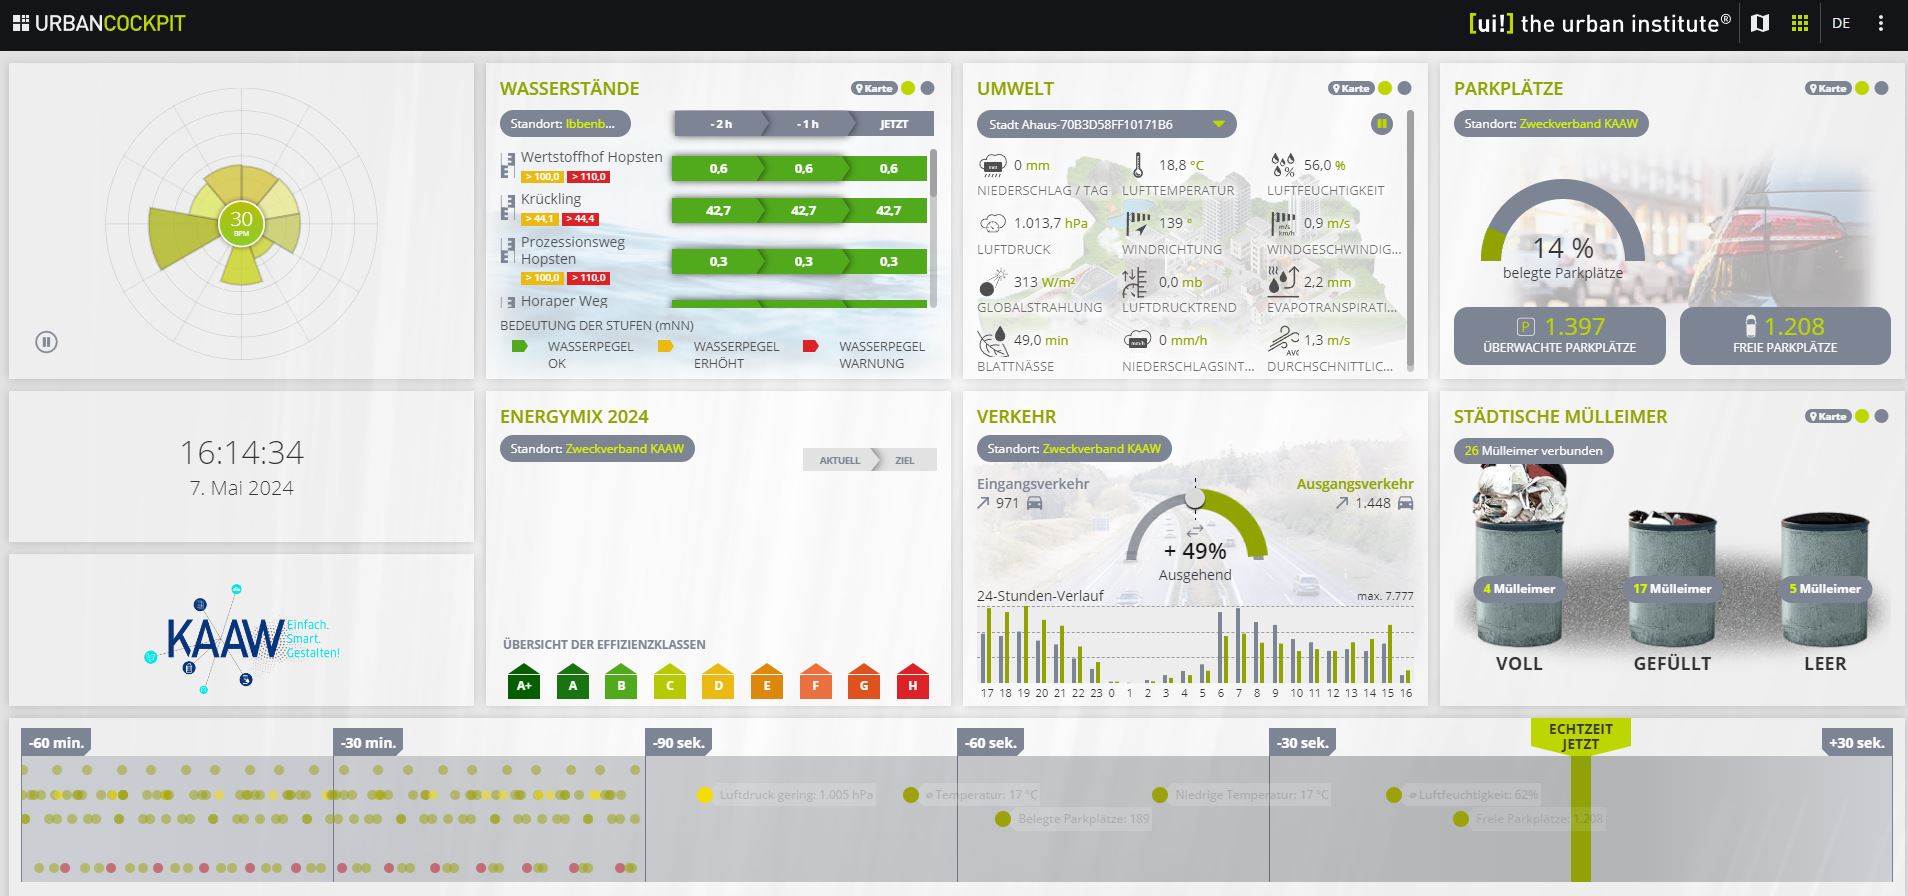
COCKPIT KAAW
-
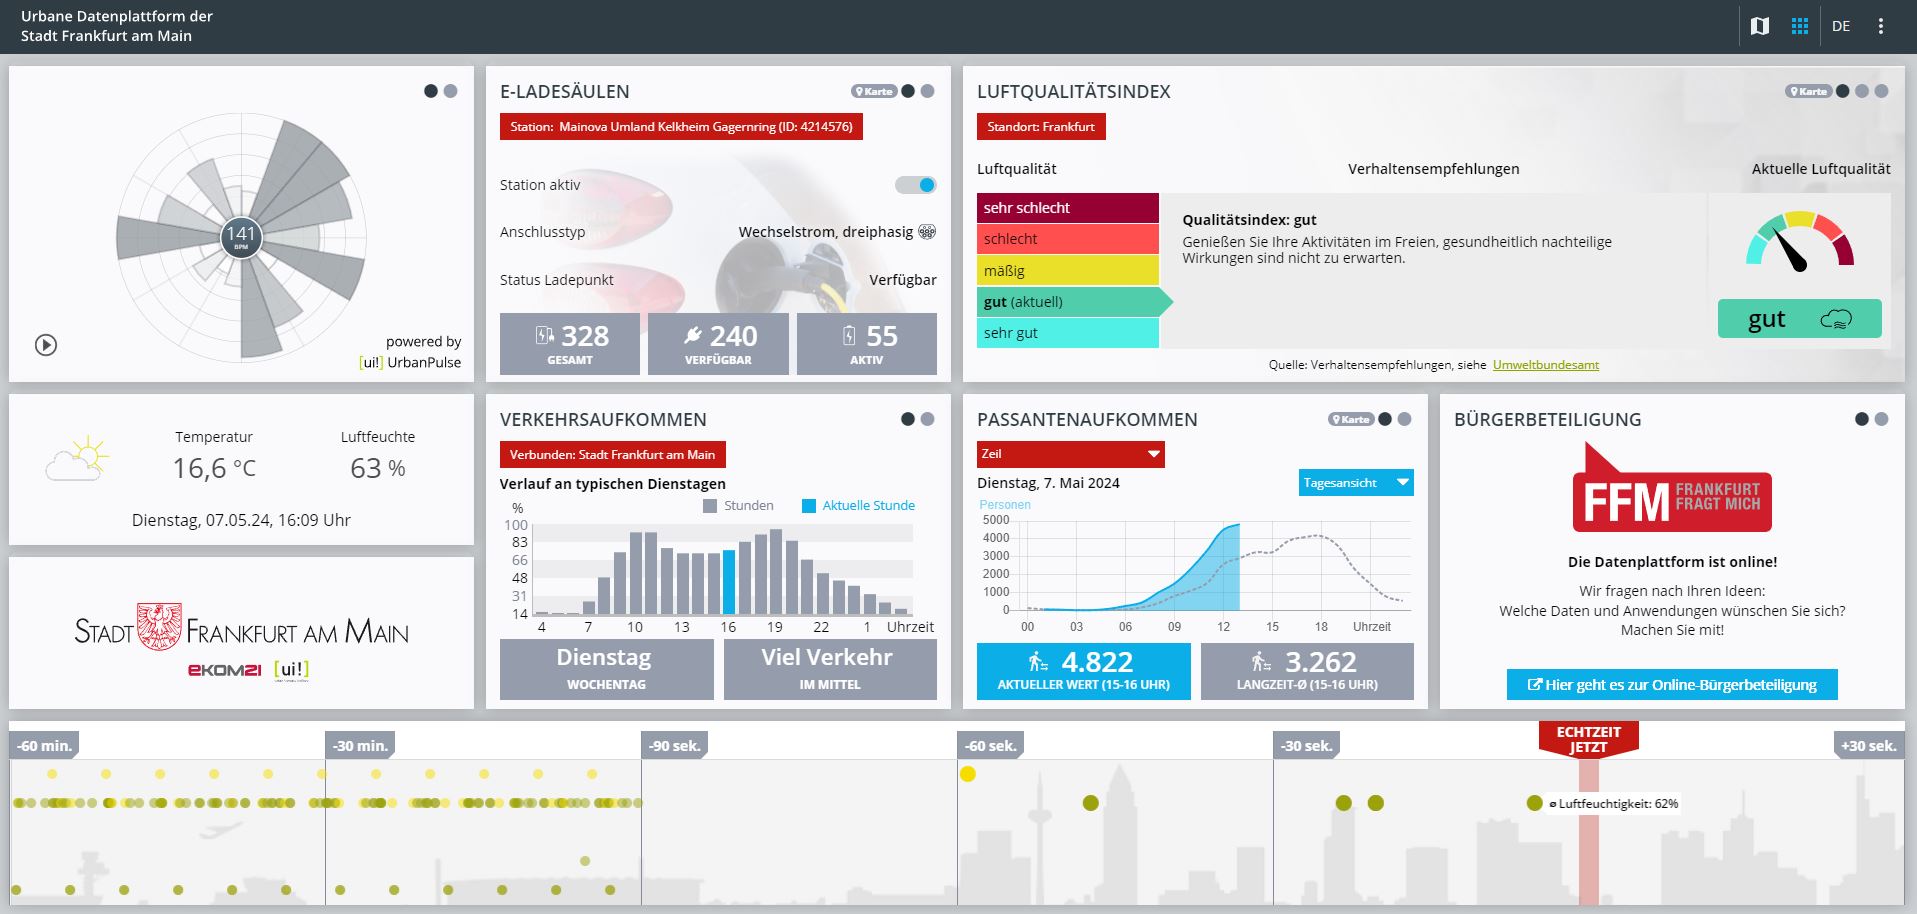
COCKPIT Frankfurt
-
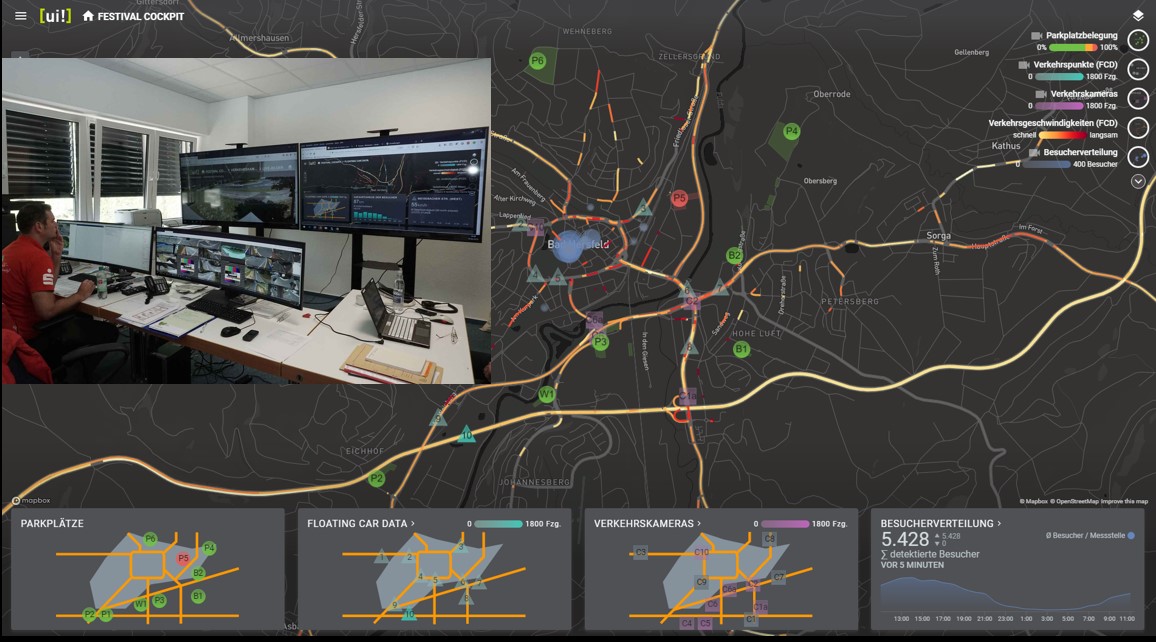
FESTIVAL COCKPIT
>> Click here and create your own COCKPIT
You have the option of putting together the tiles for your COCKPITS yourself. Just get started...
3. [ui!] DATALAB
Municipal situation picture using AI - as a decision-making aid
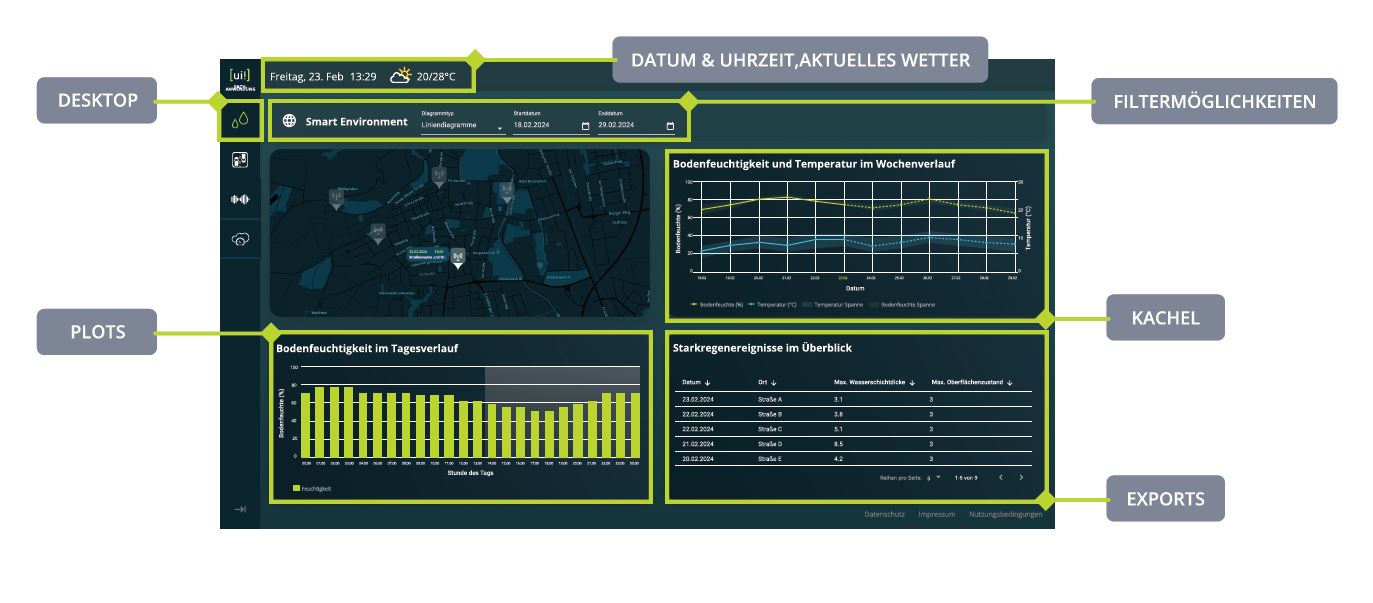
In addition to the provision of urban data prepared using [ui!] UrbanPulse for a public COCKPIT, further, more detailed information can be made available to decision-makers in a [ui!] DATALAB for the creation of a real-time-based, municipal situation picture to improve decision-making.
The visualisation tool is scalable and allows users to create their own queries and analyses. Different types of visualisation support this, such as
- Line charts
- Bar charts
- Gauge diagrams
- Heatmaps
- 2D maps
- 3D maps
- data tables
- and more...
Further filter options are:
- Date and time filter
- Slider
- Selection filter
- and more...
Forecasts
We offer automated, time series-based forecasting services based on artificial intelligence for a wide range of data sources. Forecast horizons are up to one week into the future. Forecasts complement historical data in a way that allows you to move from reacting to acting for different use cases.
Recommendations for action
Based on [ui!]'s data analyses, you receive recommendations for action in natural language or with graphical components.
-
Datalab Traffic
-
Datalab Environment
4. Our solutions for your areas of activity
Further details on our subject areas and specific offers can be found in our municipal market place for Smart City and Smart Region solutions:
[ui!] AGORA - https://agora.umi.city
[ui!] UrbanPulse
The basis for your urban data
Basic product

[ui!] ENVIRONMENT
Environmental and microclimate
Function blocks
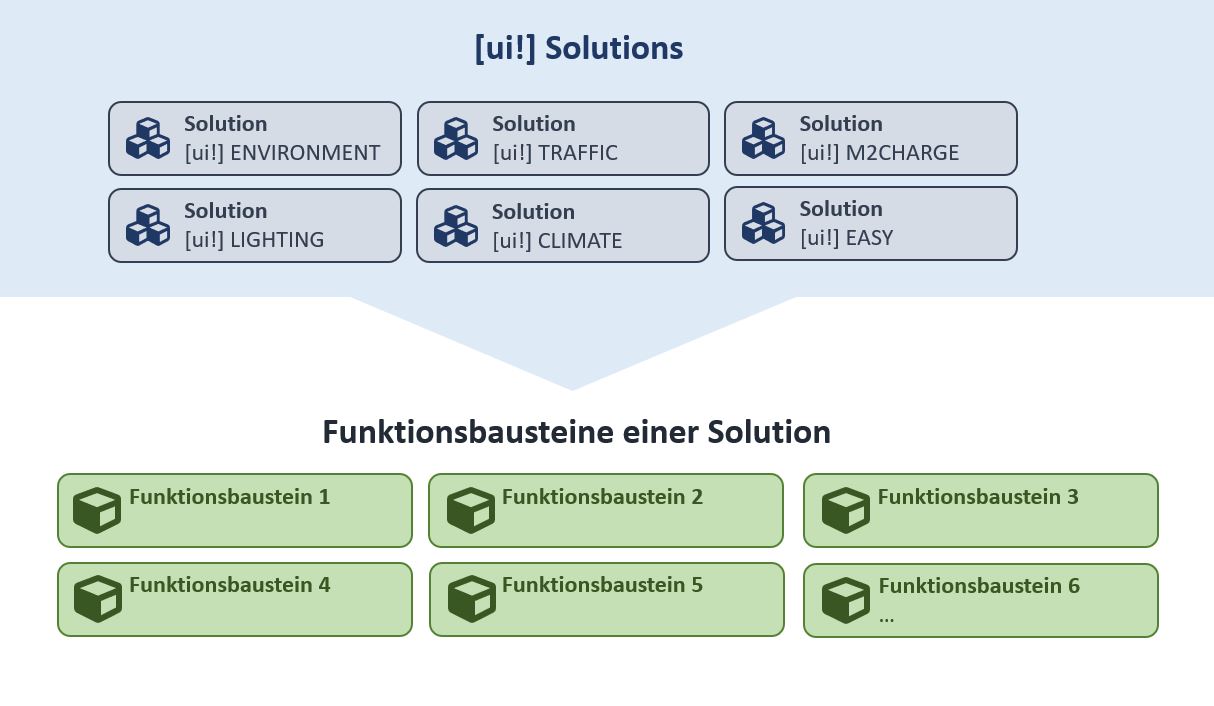
[ui!] ENVIRONMENT
Function blocks
- Soil moisture measurement
- Air quality
- Noise monitoring
- Water Level Measurement
- ...
[ui!] CLIMATE
Climate protection
Function blocks
[ui!] COCKPIT
Visualisation of your municipal data
Basic product

[ui!] Traffic
Traffic and parking space optimisation
Function blocks
[ui!] TRAFFIC
Function blocks
- Parking distribution
- Parking search traffic
- Parking space monitoring
- Parking space forecast
- ...

[ui!] EASY
An easy start to digitalisation
Function blocks
[ui!] DATALAB
Forecast & recommendations for action
Basic product
[ui!] DATALAB
Basic product
- Specialist application for municipal decision-makers

[ui!] M2CHARGE
Charging station management
Function blocks
[ui!] M2CHARGE
Function blocks
- Charging point management
- Billing and payment
- roaming
- Smart Charging
- Energy systems

[ui!] CONSULTING
Entry counselling & workshops
Function blocks
Kommunal marketplace for Smart City & Smart Region solutions - [ui!] AGORA
Would you like to learn more about our solutions?
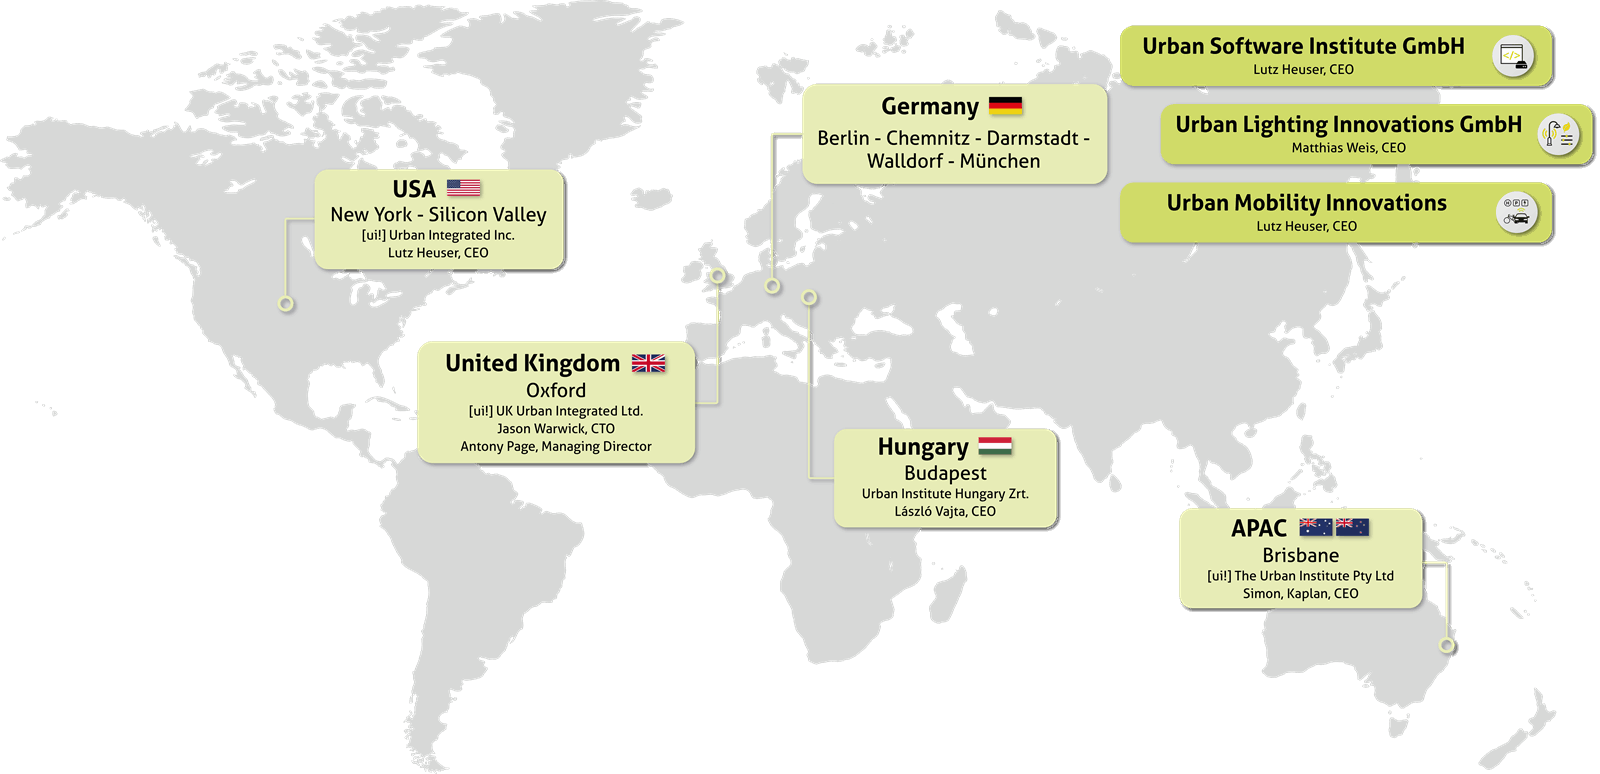
We are also available for demonstrations at our branches in Berlin, Darmstadt, München, Walldorf oder Chemnitz.
Would you like to learn more
about our solutions?

This email address is being protected from spambots. You need JavaScript enabled to view it.
Berlin: +49 (0) 30 208 47 24 40
Darmstadt: +49 (0) 371 8 57 98 59
Munich: ++49 (0) 89 6931495 40


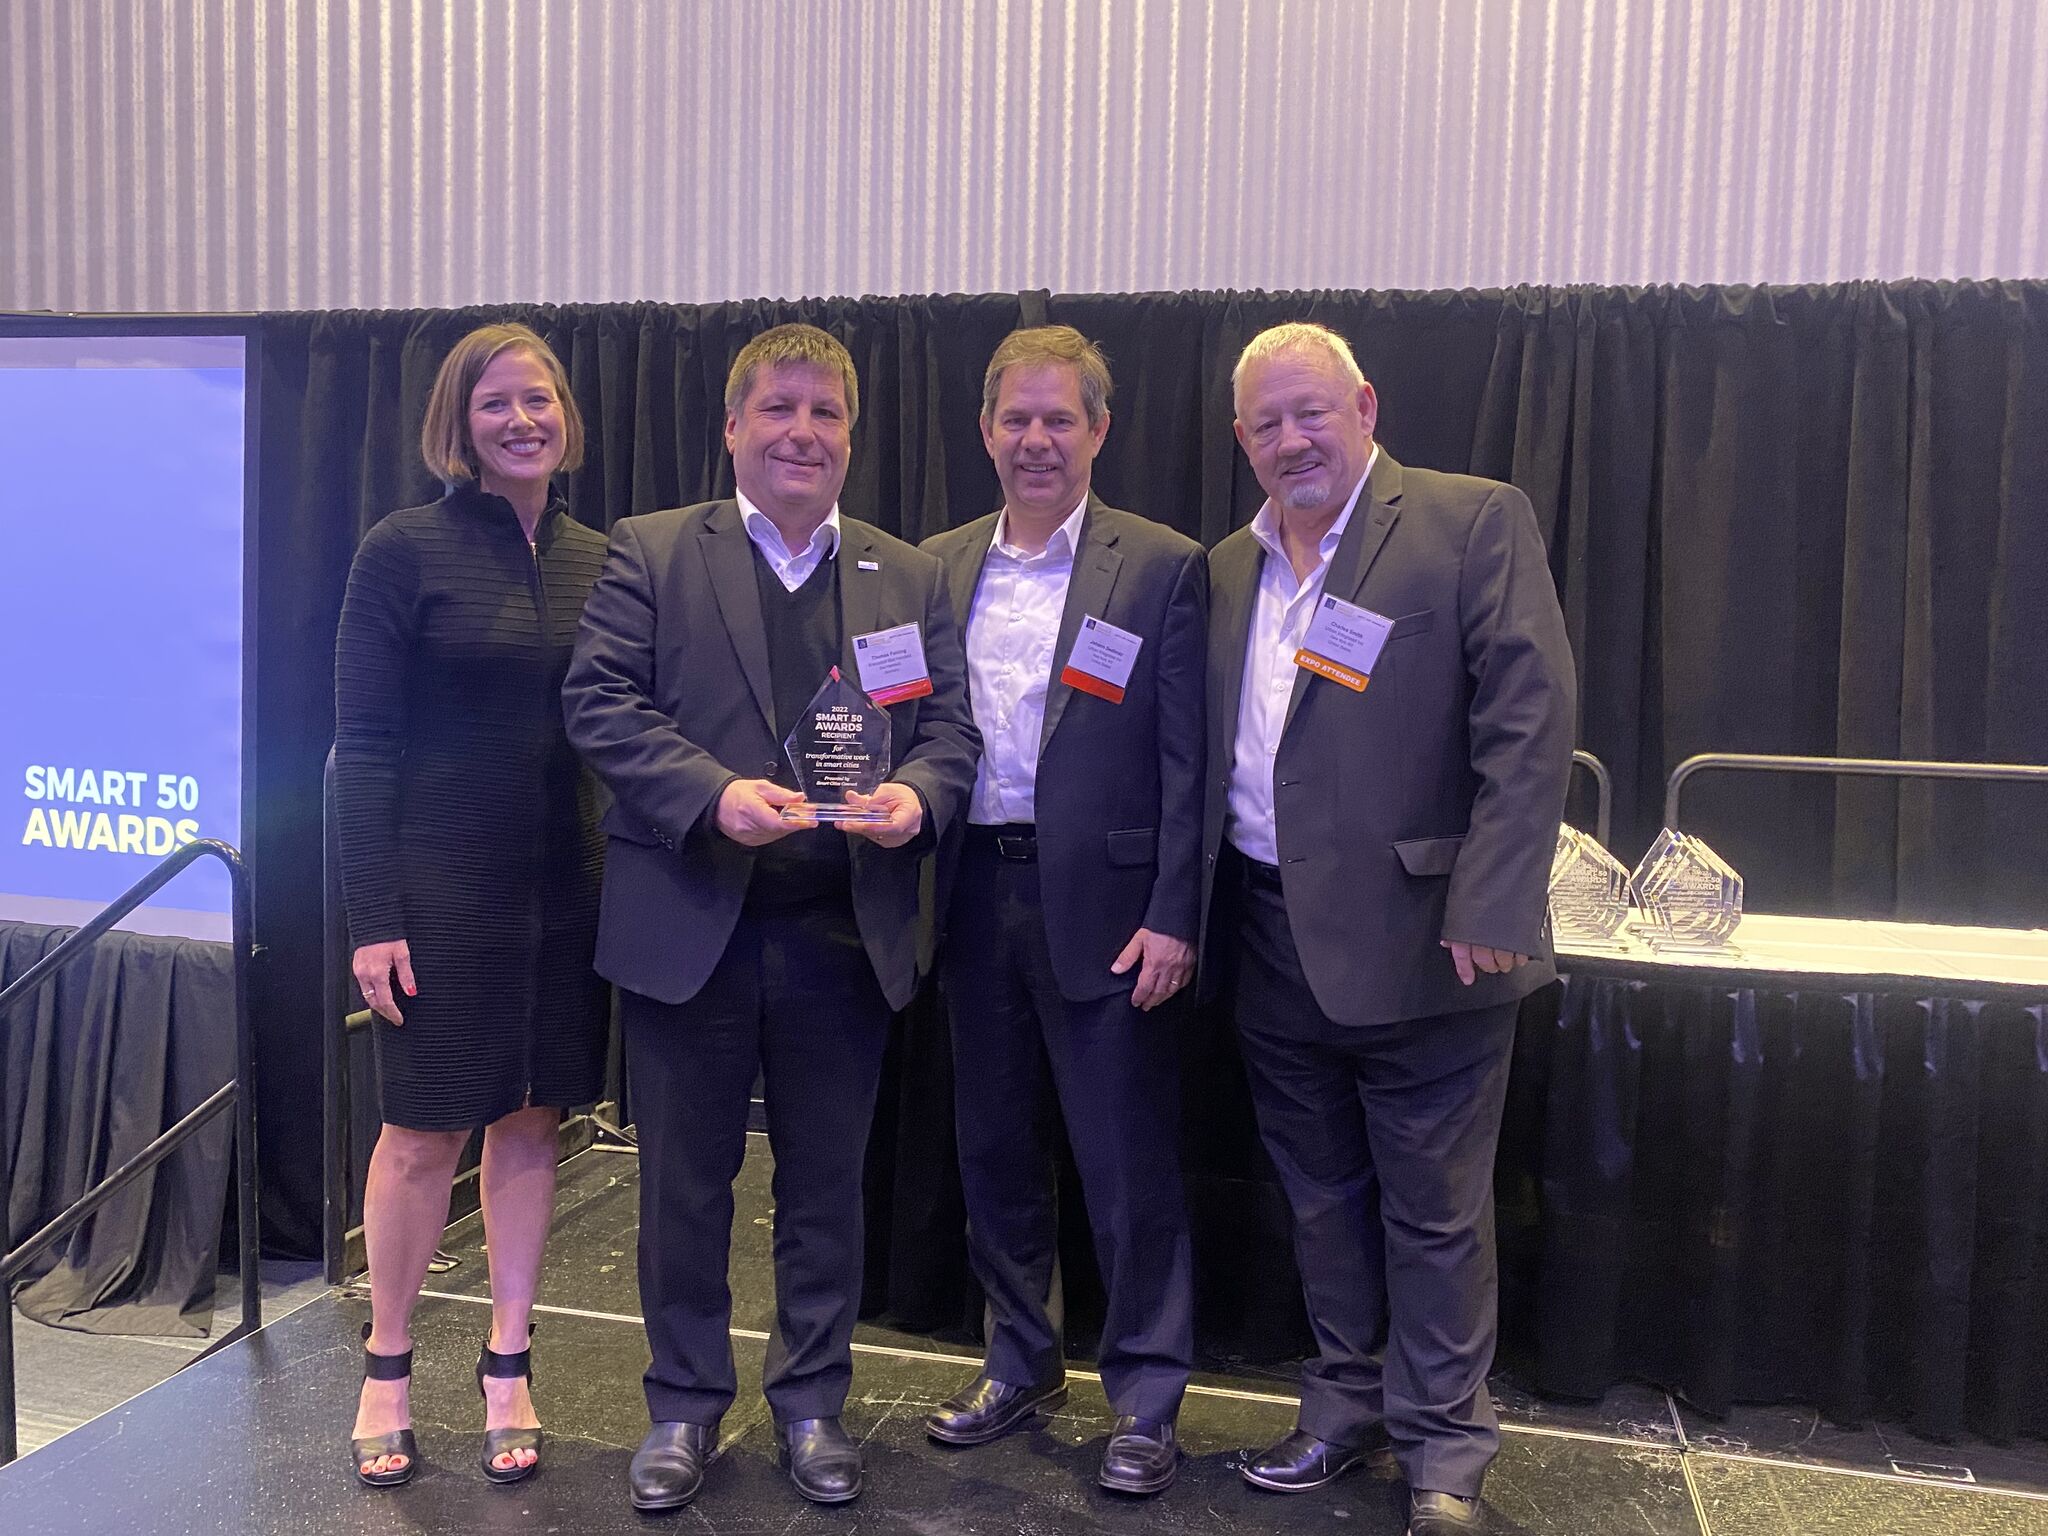
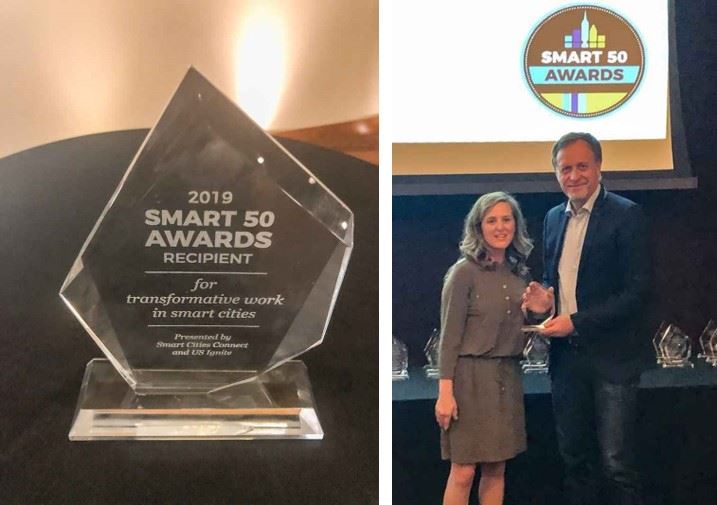
 The Smart 50 Awards of the internationally renowned organization "Smart Cities Connect" is awarded annually for global, innovative smart city projects and aims to honor some of the most influential projects and forward-looking ideas in the context of smart city and smart region.
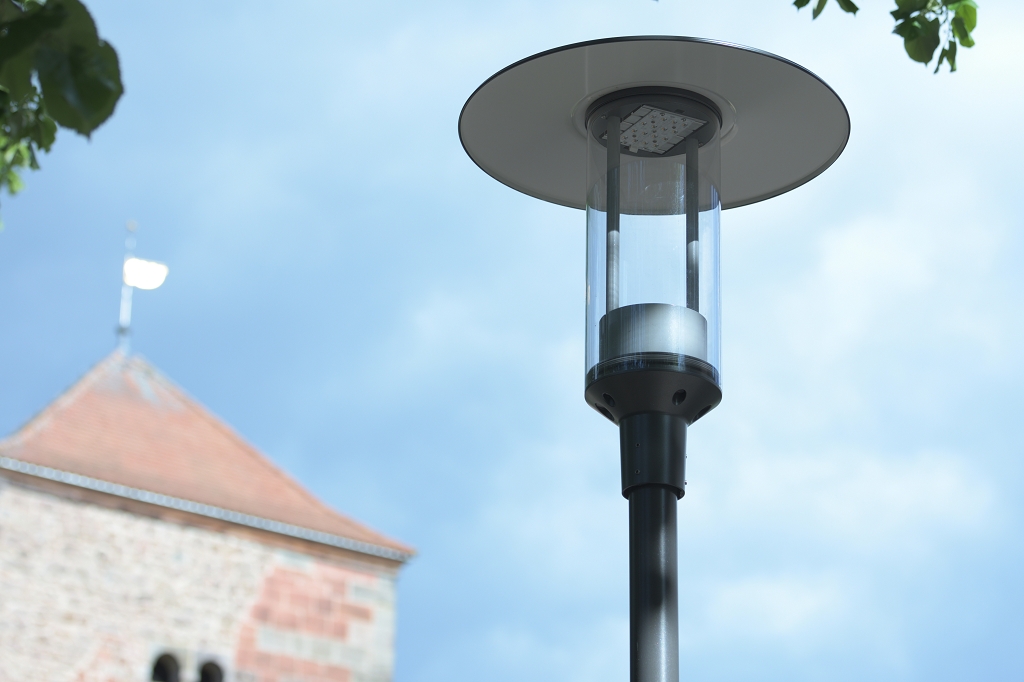 On the one hand, this includes the latest generation of luminaires, which will be permanently installed in Bad Hersfeld. Secondly, there will be intelligent digital lighting control, which will use sensors and artificial intelligence to make one and the same range of luminaires suitable for very different areas of application. "We need very different light in residential areas or in outdoor areas of the city that are close to nature than on our main roads, for example," says Fehling. "If we can use the project to create opportunities to better control light in the future in the necessary brightness and color temperature or adapted to the weather or season at the locations, that would not only be an improvement in terms of quality, but also very interesting economically."